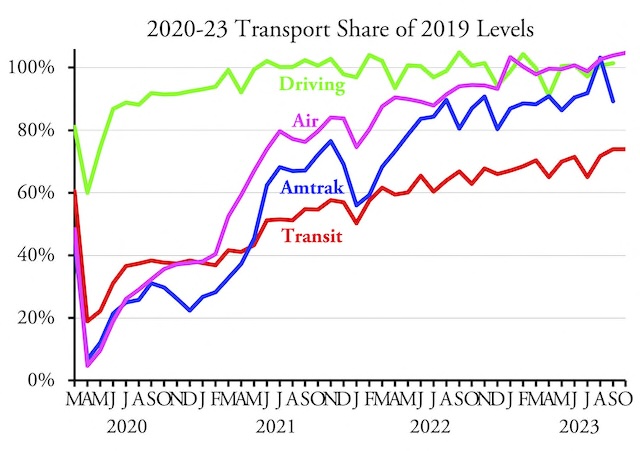
Transit carried 73.90 percent as many riders in October 2023 as in the same month in 2019, according to data released by the Federal Transit Administration yesterday. This is just a couple of hairs less than the 73.92 percent carried in September. Rail ridership was 71.0 percent of 2019 while bus ridership was 76.6 percent. Actual October ridership was more than September’s, which is the case for most years.
As with last month, New York, Los Angeles, Miami, and Houston transit systems are much better than average, carrying 78 to 85 percent of 2019 levels. Washington seems to have caught up with the average, carrying 73.7 percent. Atlanta, Boston, Phoenix, and San Francisco are all doing worse than average, carrying less than 70 percent and, in Phoenix’s case, less than 56 percent of 2019 numbers.
Amtrak and highway numbers are not yet available, but the Transportation Security Administration says that 104.8 percent as many travelers passed through their gates in October as in the same month in 2019. I’ll post Amtrak and highway numbers here when they are issued.
As usual, I have posted an enhanced spreadsheet that includes the FTA raw data in cells A1 through JL2280, annual totals in columns JM through KH, mode totals in rows 2290 through 2314, agency totals in rows 2320 through 3319, and urban area totals in rows 3321 through 3811. Column KI shows October 2023 ridership as a percent of October 2019; KJ shows October 2023 as a percent of October 2022; and KL shows January through October 2023 as a percent of January through October 2019. As in previous months, I made these enhancements on the ridership (UPT for unlinked passenger trips) and vehicle-revenue miles of service (VRM) worksheets.


