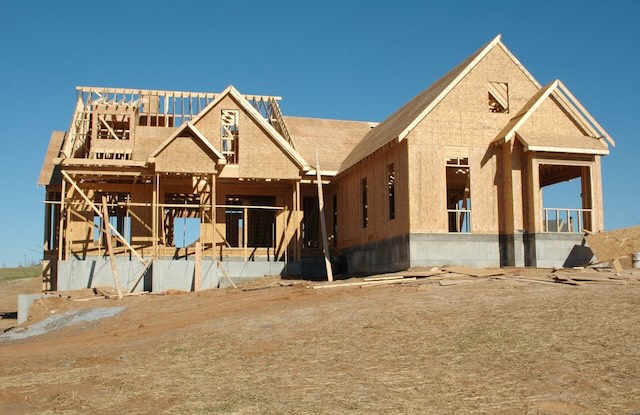
The median owner-occupied home was worth $340,000 in 2023, which was 3.5 times median family incomes, according to 2023 American Community Survey data recently released by the Census Bureau. While a value-to-income ratio of 3.5 is still quite affordable, it isn’t as affordable as the 3.0 ratio in 2019. The difference is probably mainly due to supply-chain problems and labor shortages since the pandemic.
More than 6 million single-family homes were added to the nation’s housing stock between 2019 and 2023.
Despite the increase in housing costs relative to incomes, homeownership grew from 64.1 percent in 2019 to 65.2 percent in 2023. Moreover, despite densification programs in many major cities, the population of people living in single-family homes grew from 73.6 percent in 2019 to 74.3 percent in 2023.
Surveys indicate that 80 percent of Americans prefer or aspire to live in single-family homes. That percentage is exceeded in many places, including the states of Idaho, Indiana, Iowa, Kansas, Michigan, Minnesota, Nebraska, Ohio, Pennsylvania, and Utah. Among urban areas, more than 80 percent of the residents of the Boise, Colorado Springs, Kansas City, Indianapolis, Memphis, Ogden, Oklahoma City, Omaha, Philadelphia, Pittsburgh, Riverside-San Bernardino, Stockton, and St. Louis urban areas, among others, live in single-family homes.
Housing remains least affordable in Hawaii, where median home prices average 7.4 times median family incomes, and California, where the average is 6.6. Housing prices are less than three times family incomes in nineteen states, including Kentucky, Indiana, Louisiana, Pennsylvania, and Wisconsin, among others.
Santa Barbara remains the least affordable urban area, with median prices more than 11 times median family incomes. The top ten least-affordable urban areas are all in California or Hawaii, but somehow Bozeman, Montana has bumped its way up to number 15 and Bellingham, Washington is number 20. At the other extreme, the most affordable urban areas appear to be in Illinois, while Indianapolis, Kansas City, Louisville, and Omaha are all quite affordable.
To save you time, I’ve downloaded data files for many housing tables that present data for states, counties, cities, and urban areas. Generally, only areas with more than 65,000 people are included. If your area isn’t included, it means the Census Bureau didn’t take a large enough sample to get a statistically reliable result. Many of the files have some calculations in the righthand columns showing percentages of homeownership, single-family populations or similar statistics.
You can download tables B19113 (median family incomes), B25077 (median home values), B25032 (owned/rented by units), and B25033 (population by units). I’ve also combined the first two tables to calculate value-to-income ratios.


Looks like Paris is taking AP’s advice and getting rid of their antiquated subway cars. I didn’t read the whole article but I assume they will be replaced them with brand new automobiles for every citizen, which will be cheaper overall.
https://edition.cnn.com/travel/paris-new-metro-network/index.html
“TxDOT’s analysis shows I-45 expansion displacements will reduce Houston’s annual tax revenue by between $153 to $314 million. Houston’s share of that is 5-10% of FY2025 General Fund. If the city wants to save itself, they need to stop TxDOT.”
https://x.com/michael_ulf/status/1847361794714792013
Flattening cities to build highways through them not only physically destroys them, but financially too. But for some like AP, that’s a feature, not a bug.