
The Southeastern Pennsylvania Transportation Authority (SEPTA) is buying new vehicles to replace 130 light-rail cars. Normally, my suggestion when rail systems wear out is to replace them with buses, but in this case it’s worth a close look.

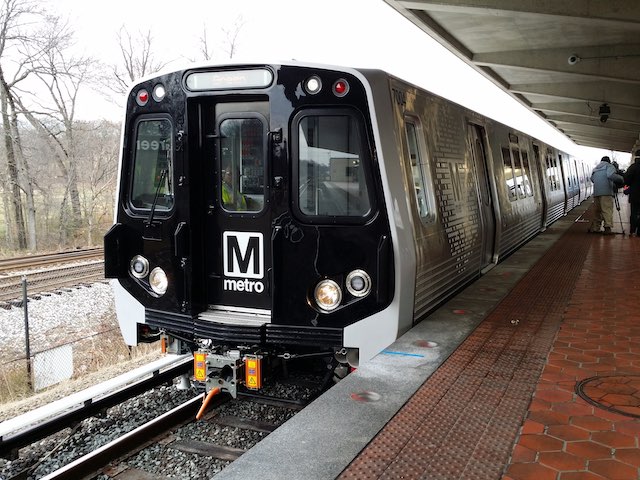
One of SEPTA’s 40-year-old light-rail cars. Photo by jpmueller99.
The 130 cars are expected to cost $800 million, or a little over $6.1 million apiece. That’s a lot more than a bus, which typically costs under $500,000 if Diesel-powered and under $1 million if electric. But buses have an expected lifespan of only about 15 years, while SEPTA’s light-rail cars are 40 years old. The railcars are also a little larger than buses, having 50 seats compared with an average of 40 seats on SEPTA buses. Still, the railcars cost more than $3,000 per seat-year, while even million-dollar buses cost only $1,666 per seat-year. Continue reading


.jpg)