CBO Endorses MBUF

The Congressional Budget Office has issued a report encouraging Congress to promote the use of mileage-based user fees to pay for roads. The current highway funding process is very inefficient, says the report. For example, urban roads are most heavily used and need the most maintenance, but most maintenance dollars are spent on rural roads.

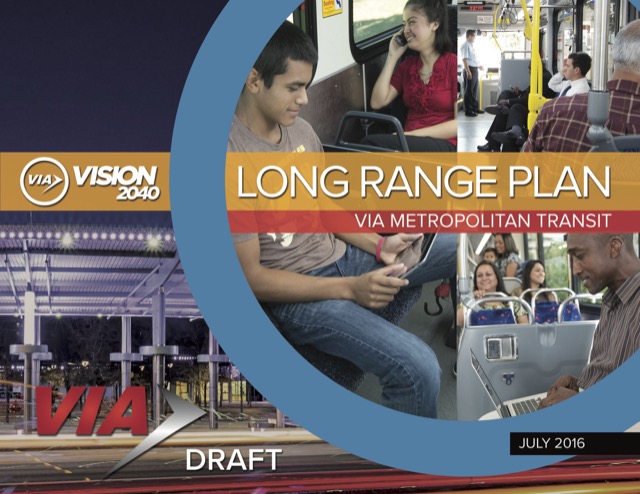
Click image to download this 1.6-MB report.

The report offers three solutions to this problem: mileage-based user fees; allocating spending on the basis of benefits and costs; and linking spending to “appropriately chosen” performance measures. The report does not say so, but the problem with the second and third solutions is that assessments of benefits, costs, and performance measures by government agencies inevitably become political. Attempts to use either of these solutions at the state level have had, at best, mixed results and in fact mostly negative ones.

Continue reading

The FTA Doesn’t Care How Many People Ride Your Small Starts Transit Project

When the Antiplanner published data about the Federal Transit Administration’s 2017 New Starts recommendations a few days ago, I assumed that projects that had no projections of future transit riders were still in the early planning stages. That may have been true for some, but at least for some there are no projections because the FTA doesn’t care how many people will ride the new transit lines that it funds.

When Congress created the New Starts program in 1991, it specified that funded projects must be cost-effective at improving transit and mobility. Initially, the FTA asked transit agencies to estimate the cost per new transit rider attracted by the projects. Later, it asked that they estimate the cost of saving travelers one hour of time through faster transit and congestion relief.

The Obama administration, however, discarded all of those measures and instead wrote a cost-effectiveness rule that essentially said, if you can measure the cost, your project is cost-effective. The FTA New Starts grant application form still requires agencies to calculate the cost per hour of time saved.

Continue reading

Transit Facts and Biases

The American Public Transportation Association (APTA) has recently posted scanned versions of its annual Transit Fact Book dating back to 1942. While most of the data from these earlier versions has been transcribed to an Excel spreadsheet in the latest edition, it is still interesting to see how the organization’s priorities have changed.

The last honest fact book.

Once known as the American Transit Association, the organization was then headquartered in New York City, which made sense as New York is the nation’s largest transit market. Today, of course, it has adopted a confusingly broad name that seems to embrace modes of travel other than urban transit and has relocated to Washington DC, which makes sense as Washington is the nation’s largest source of public subsidies.

Continue reading

Myths of Obesity and Millennials

Nine years ago, the Antiplanner called claims that suburbs caused obesity “junk science.” Research since then has validated that view.

For example, Health and Place journal is focused on “all aspects of health and health care in which place or location matters,” so might be presumed to have a slight bias for an assumption that place influences obesity. Yet it published a 2012 literature review of dozens of papers on the subject that concluded that most failed to account for self-selection bias, that is, that people who might be overweight prefer to live in the suburbs. Thus, any relationship they may have found between weight and suburbia “cannot provide strong support for causality.”

A paper published by MIT’s Center for Advanced Urbanism reviewed several other metastudies that reported “the inconclusive nature of the relation between urban form and public health.” The MIT paper was written specifically in rebuttal to a paper by people associated with the Congress for the New Urbanism, and chided the authors of that paper for failing to disclose their association with that group, “an organization known for certain urban biases linked to their design agendas.”

Continue reading

Ending the Longest Job Interview in History

Last week, the Washington State Senate refused to confirm Lynn Peterson as state Secretary of Transportation, effectively firing her three years after she was nominated to the job by Governor Jay Inslee (and during which she served in the job). In effect, the Senate turned her down after a three-year interview period.

Peterson was a curious choice for the job as she was an Oregonian who had been a Clackamas County Commissioner. Her background also included working as a transportation planner for Portland’s Metro, transit planner for TriMet, and an advocate for 1000 Friends of Oregon. Given that resume, she clearly supports the “build-it-and-they-will-come” ideals of light rail and conversely, don’t-build-it-and-they-won’t-come opposition to highways. Just as Washington imported its 1990 land-use law from Oregon’s 1973 law, it made sense to import an anti-highway, pro-high-cost transit planner from Oregon to run Washington’s transportation department.

Of course, it only made sense if you believe those ideas, but from any realistic view they are nonsense. Portland and Seattle both suffer from housing affordability crises born out of the inane “density-reduces-driving” myth. Their ever-more-expensive light-rail and streetcar lines combined with subsidies to transit-oriented developments are bankrupting the cities. Failing to build new roads hasn’t led people to drive less; instead, traffic congestion (measured by hours of delay per commuter) has more than tripled in Portland and more than doubled in Seattle since 1982.

Continue reading

New Starts 2017

The Federal Transit Administration has published its New Starts recommendations for 2017. The recommendations include profiles of more than 60 different transit projects, including bus-rapid transit (BR), streetcars (SR), light rail (LR), commuter rail (CR), and heavy rail (HR). Only 60 projects are shown in the table below as a few, such as the San Antonio streetcar, have been cancelled or at least are “on hold.”

CityProjectModeMilesCapitalCost/mi
PhoenixS. CentralLR5.0531106
TempeStreetcarSR3.018361
LAConnectorLR1.91,403738
LAStreetcarSR3.87520
LAPurple 1HR3.92,822720
LAPurple 2HR2.62,467949
Sac'toStreetcarSR4.215036
CalTransElectrifiedCRC51.01,75934
San DiegoMid-Coast LR10.92,171199
San Fran.CentralLR1.71,578928
San Fran.Van NessBR2.016381
San JoseEl Camino BR17.418811
San JoseBerryessaHR10.22,330230
San RafaelSMARTCR2.14320
Santa AnaStreetcarSR4.128970
DenverEagleCR30.22,04368
DenverSE ExtLR2.322497
Ft. Laud.WaveSR2.817362
Ft. Laud.BrowardSR5.00
J'villeEastBR18.5342
J'villeSWBR12.9191
OrlandoOIACR5.522541
OrlandoSouthCR17.218711
OrlandoNorthCR12.2696
HonoluluHARTHR20.05,122256
ChicagoAshland BR5.411722
ChicagoRed & PurpleHRC5.6957171
Indy.Red BR13.1967
BostonMedfordLR4.72,298489
MarylandPurpleLR16.22,448151
Gr. RapidsLakerBR13.3715
LansingMichiganBR8.516419
Minn.Blue extLR13.010
Minn.OrangeBR17.01519
Minn.SWLR14.51,774122
K. CityProspectBR10.0545
CharlotteBlue extLR9.31,160125
CharlotteGoldSR2.515060
CharlotteBlueHRC9.6404
DurhamOrangeLR17.11,800105
Albuq.RapidBR8.812614
Reno4th StBR3.15317
RenoVirginiaBR1.86033
AlbanyRiverBR15.0352
AlbanyWashingtonBR8.0648
NYCCarnarsieHRC6.027446
NYCWoodhavenBR14.023117
ColumbusClevelandBR15.6473
PortlandMilwaukieLR7.01,490213
PortlandPowellBR14.0755
DallasCBDLR2.4650271
DallasRed & BlueLRC48.11192
El PasoMontanaBR16.8473
Ft. WorthTEXRailCR27.299637
HoustonUniversityLR11.31,563138
ProvoBRTBR10.515014
EverettSwiftBR12.3675
SeattleCenterSR1.3135104
SpokaneCentralBR5.87212
TacomaLink extSR2.416669
A “C” after a mode abbreviation means that project is a capacity increase or reconstruction of an existing line. An “ext” at the end of a project name is an extension of an existing line. There are 60 projects in the table; to see all 60 at once, select “Show 100 entries.” Projects are sorted in alphabetical order by state, but you can resort by any column.

For the projects in this year’s report, the average cost of new streetcar lines is $45 million per mile; light rail is $163 million per mile; heavy rail is $347 million per mile; and commuter rail is $38 million per mile. Of course, cost overruns are likely for a majority of these projects, so the final costs are likely to average 20 to 50 percent more. Even without the overruns, these costs are outlandish, as the nation’s first light-rail lines cost only around $10 million to $25 million per mile (after adjusting for inflation), and streetcars were supposed to be even less expensive than that.

Continue reading

DC Ridership Falls Despite Population Growth

As the Antiplanner noted last week, Los Angeles is not the only region experiencing declining transit ridership. Another is Washington, DC, where a recent report from the Washington Metropolitan Area Transit Authority (WMATA aka Metro) revealed that ridership has fallen to the lowest level since 2004. The agency’s financial situation is so bad that WMATA’s number-two executive has resigned and, ominously, the agency has hired a bankruptcy attorney to help it deal with its problems.

As detailed in the actual report, rail revenues and ridership in the first half of F.Y. 2016 are both down by 7 percent from the same period in F.Y. 2015. Metrorail ridership peaked in 2009, and if the second half of F.Y. 2016 is as bad as the first, annual ridership will be down as much as 30 percent from that peak despite a 15 percent increase in the region’s population. Bus ridership and revenue in 2016 is also down but by only about 3 percent below 2015.

Metro rails ridership declines, continued the report, are due to declining service reliability. Median travel times, the unpredictability of travel times, and the frequency of major service delays have all increased.

Continue reading

The Future of Federal Lands

The Antiplanner was in Washington, DC on Tuesday to testify before the Federal Land Action Group, an unofficial Congressional committee made up of representatives from western states who support more local control of federal lands. Several of the committee members expressed the opinion that federal land would be better managed by the states because the easterners who made up a majority of Congress didn’t understand the West.

While I believe the federal lands could be better managed, I had to throw cold water on some of their ideas. The real debate, I said, wasn’t between easterners and westerners. It was between urbanites who have little connection with agriculture, forestry, and mining, and ruralites whose jobs depended on those sectors of the economy. Ninety percent of residents of the West live in urban areas that occupy just one percent of the land, and–unlike forty or so years ago–few if those urbanites have jobs that directly depend in mining, logging, or farming.

The population of the most rural state in the West, Montana, is 55 percent urban; Wyoming and Alaska are 65 percent; Idaho and New Mexico from 70 to 80 percent; and all the others are more than 80 percent urban. Many people in these urban areas moved to or stay in the West because they love the easy access to recreation on federal lands, and polls show that most of them support continued federal ownership of these lands. Can anyone really think that ranchers and other rural interests are going to get more sympathy from the West’s urbanites than those from the East?

Continue reading

Low Fares Beat Steel Wheels

Last week, the Antiplanner highlighted an LA Times story showing that Los Angeles transit ridership was dropping despite billions being spent on transit improvements. A blogger named Ethan Elkind wrote a response arguing that a graph in the Times story was unfair because it showed that Los Angeles transit ridership peaked in 1985.

That high point was reached, says Elkind, because L.A. County had kept bus fares at 50 cents for three years in the early 1980s. After the region started building rail, it raised fares and ridership declined. “So choosing 1985 as your baseline is like climate change deniers choosing an unusually warm year in the 1990s to show that global warming hasn’t really been happening since then,” says Elkind. (A better analogy would be transit advocates’ habit of using 1995–a low transit year nationwide–as a starting point to show increasing transit ridership.)

Continue reading

A Streetcar Plan Grows in Brooklyn

New York is far denser than any other large American city, with an average of 27,000 people per square mile compared with 2,500 to 4,000 for most American cities. Although the city is criss-crossed by an extensive subway system, there are still some neighborhoods that are more than half a mile from a subway station.

So naturally, what those neighborhoods need is an ultra-low-capacity, high-cost form of urban transit: a streetcar. At least, that’s what Mayor Bill de Blasio thinks: last week, he proposed to spend $2.5 billion building a 16-mile streetcar line connecting Brooklyn with Queens.

Continue reading