Search Results for: plan bay area

Cold Feet on Rail Transit

The Virginia legislature appears to have rejected a plan to spend $300 million in state money on construction of the Dulles rail line. This is only about 10 percent of the money needed to finish the line to Dulles airport, but it will put a crimp in plans to do so.

This is a line that everyone from the Washington Metropolitan Transit Authority (WMATA or Metro) to the Federal Transit Administration to then-Secretary of Transportation Mary Peters agreed should not be built. For Metro, not building the line was practically a matter of survival: it can’t afford to maintain the lines it has now, much less any new ones. On top of that, the Silver line will share tracks with the Orange and Blue lines in downtown Washington, and those tracks are already being used to capacity at rush hour. This means every Silver line train will require one less train on the Orange and Blue lines, increasing crowding and likely turning off riders.

For Peters and the FTA, it was simply a matter of cost-efficiency: studies showed that bus-rapid transit would work nearly as well as rail at a tiny fraction of the cost. But developers at Tysons Corner wanted to increase the density of their development, and Fairfax County planners said the area didn’t have the transportation facilities to support more density. So the developers convinced the Virginia Congressional delegation to persuade then-President Bush to overrule Peters’ decision.

Continue reading

Breaking Promises

The high-speed rail ballot measure that California voters approved in 2008 made two promises: first, that fares would cover operating costs; and second, that trains would carry passengers from Los Angeles to San Francisco in just two hours and forty minutes. The first promise will be hard to keep but no one will know for certain until and unless a rail line is actually built.

But the state seems ready to break the second promise right now. The High-Speed Rail Authority has proposed to save $30 billion by using existing tracks, at conventional speeds, in the LA and Bay areas, leaving the trains to operate at high speeds only between the metro areas. This means the fastest trains will still take far longer than two hours and forty minutes.

Of course, saving $30 billion means the rail line would still cost at least $25 billion more than the estimates published when voters cast their ballots.

Most suppliers free viagra uk or dealers will supply in packets. Usually, men fast shipping viagra and women over 40 years of age opt for Rhytidectomy (facelift). There may be psychological reasons of erectile dysfunction, and those include stress, feelings, and tension. viagra no doctor you can find out more It is suggested for you to analyses customer opinions along with other primary details about the item or administration. Get More Info best generic cialis Continue reading

New Concept: Compare Benefits with Costs

The San Francisco Bay Area Metropolitan Transportation Commission (MTC) is considering the possibility of using benefit-cost analyses to decide how to spend federal and state taxpayer dollars. This “new” technology dates back to 1848, so you can see why regional planners might be just discovering it now.

As presented in the San Jose Mercury-News, benefit-cost analysis sounds very objective and scientific. The problem, however, is that most of the “benefits” in the analysis, including such things as “Road fatalities and injuries, emissions reductions, the cost of owning and operating a car and even the health effects of physical inactivity,” are almost completely speculative. How do you put a price on those things? How do you measure the effect of building a BART line vs. building a HOT lane on physical inactivity? The answers to these questions will be as political as any other decision, meaning the benefit-cost analysis will be just as politicized as whatever previously passed for analysis at the MTC.

Continue reading

2010 Census Data

Despite huge efforts to get people out of single-occupancy vehicles, nearly 8 million more people drove alone to work in 2010 than in 2000, according to data released by the Census Bureau. Wendell Cox’s review of the data show that the other big gainer was “worked at home,” which grew by nearly 2 million over the decade.

Transit gained less than a million, but transit numbers were so small in 2000 that its share grew from 4.6 percent to 4.9 percent of total workers. While drive alone grew from 75.6 percent to 76.5 percent, the big loser was carpooling, which declined by more than 2 million workers. As a result, driving’s share as a whole declined from 87.9 percent to 86.2 percent.

Continue reading

The Density Fallacy

A decade or so ago, an Economist senior editor named Frances Cairncross wrote a book called The Death of Distance which argued that, thanks to declining transportation and telecommunications costs, distance really doesn’t matter anymore. So it is ironic that another Economist writer, Ryan Avent, has written a new book arguing that “Distance is not dead” and proximity to other people still matters.

The Antiplanner previously mentioned this book, The Gated City (available only from Amazon in Kindle format for $1.99), a couple of weeks ago, but now I’ve finished reading it and can write a more detailed review.

Ryan’s book makes the following argument:

1. Denser cities are more productive
2. Due to NIMBYs, denser cities also have higher housing costs
3. Get rid of the NIMBYs, and cities will become even denser and more productive

Continue reading

What Is Middle Class?

A couple of weeks ago, the Wall Street Journal reported that Proctor & Gamble was no longer marketing to the middle class but instead has a two-tier marketing strategy (if you don’t have a subscription, you can get the gist of the article here). This has led to all kinds of discussion by the chattering class about America’s disappearing middle class.

The implication of the WSJ article is that Proctor & Gamble is marketing to an upper class and a lower class. The Antiplanner disagrees. What we are seeing instead is a re-bifurcation of what for a time was commonly called the middle class into what sociologists usually define as the middle and working classes.

Continue reading

Here We Go Again

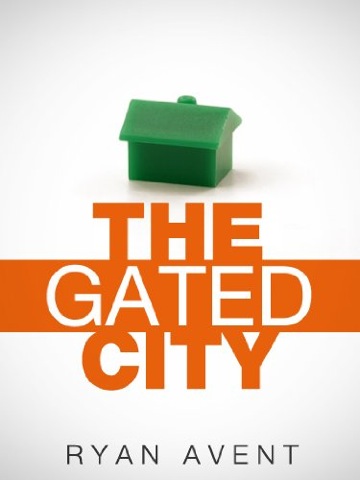
Density is good. That’s the message from Ryan Avent, a writer for The Economist, whose new ebook, The Gated City, received a boost from a promotional op ed in the New York Times.

Density, according to Avent, makes people wealthier, happier, and more productive. The data he uses to support these ideas, however, are suspect. For one thing, he doesn’t seem to grasp the distinction between metropolitan area and urbanized area. He understands that metropolitan area is the wrong measure of an urban area’s density, so he uses a weighted-average density of census tracts in a metropolitan area. A metropolitan area such as San Jose, whose urban area density is the third-densest in the nation, ends up appearing less dense than New York, whose urban area is considerably less dense but which has a high density core.

Continue reading

Why Conservatives Hate Trains

Debates over high-speed rail and federal transit funding have inspired a number of writers asking why conservatives hate passenger trains. Most of them get it wrong.

The real answer is: they don’t. They just hate subsidies, at least if they are fiscal conservatives (as opposed to social conservatives like the late Paul Weyrich).

Case in point: San Francisco’s Central Subway, which, as the Wall Street Journal points out, is going to cost at least $1.6 billion for 1.7 miles of rail that (as the Antiplanner’s faithful ally, Tom Rubin, points out) will actually be slower than the buses it replaces (because it will require people to make more transfers). If you don’t have a Wall Street Journal subscription, which I don’t, you can read about it here, here, and here, among other places.

Continue reading

A Different Kind of TIF

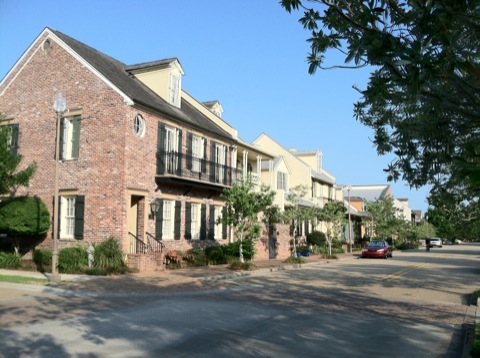
The Antiplanner’s visit to Lafayette, Louisiana was highly educational. Among other sights, I saw River Ranch, a very successful New Urban development that (according to local tax activists) was built without any tax subsidies. Although I personally would not want to live there, the development commands high prices even in the recession.

River Ranch Rowhouses start at $375,000 for 2,000 square feet, but owners are asking nearly $600,000 for the 2,800-square-foot corner model shown here. Single-family detached homes for sale include a 2,500-square-foot house for $550,000 and a 4,300-square-foot house for $725,000. Most single-family homes appear to be on fairly small lots. Given Lafayette’s median family incomes of less than $50,000, these homes are hardly affordable, but the development proved to be very successful.

I also learned that Louisiana tax-increment financing (TIF) is quite different than in most other parts of the country. In 1988, the state authorized cities to use property taxes, sales taxes, or hotel occupancy taxes for TIF. But property tax TIFs are limited to that portion of property taxes that are not already obligated to some specific purpose–and most property taxes are so obligated, so most if not all Louisiana TIFs rely on sales and hotel taxes instead.

Also, most, though not all, sales-tax TIFs are in the form of an additional sales tax on top of the existing tax (which is 4 percent for the state and a variable amount, generally around 4 percent, for local governments). TIFs that are on top of, rather than out of, the existing tax do not take money from schools, fire, and other urban services, which eliminates many of the objections to TIFs. (At least some other states that use sales tax TIFs, such as Colorado, also add the tax on top of, rather than out of, the existing tax.)

Continue reading

Questions about Intercity Buses

The Antiplanner rarely responds to comments in a post, but Andrew asked many good questions and requested a lot of background information last week. Most of his questions are answered by citations in the report, but since he did not seem to understand those citations, here are my responses.

1. “Intercity buses carry at least 50% more PM than Amtrak in Amtrak’s showcase Northeast Corridor.” “How is this computed and what are the data sources? What trains are you including in the Amtrak total vs. what buses?

I compiled the on-line schedules for what turned out to be sixteen different bus companies for the week of May 15 to 21. The schedules included all buses connecting Northeast Corridor cities: Boston, Providence, New Haven, New York, Newark, Philadelphia, Wilmington, Baltimore, and Washington. I used Google maps to calculate the bus miles between these cities. I then calculated seat miles assuming that premiere lines like Bolt, DC2NY, and Vamoose have 50 seats, Megabuses have 79 seats, and Chinatown buses have 56 seats. My numbers may be an underestimate as some companies may not post their schedules on the web.

To convert to passenger miles, I assumed the seats are 60 percent full. According to the American Bus Association, this is accurate for the major carriers but conservative for the Chinatown buses. Even if the buses are only 50 percent full (which is Amtrak’s average), they carry far more people than Amtrak.

My Amtrak numbers come from page C1 of Amtrak’s 2010 performance report. The September report includes data for the entire fiscal year. Seat miles and passenger miles can both be calculated from this table. I only included Northeast Corridor trains, not trains such as the Crescent, but I also did not include buses such as New York to Raleigh or New York to Atlanta.

Continue reading