Search Results for: rail projects

The Benefits of Congestion Relief

Data published by the University of Minnesota Accessibility Observatory a few months ago reveals some of the benefits of congestion relief that resulted from the COVID pandemic. I’ve used 2019 data in the past to show that residents of U.S. urban areas can reach far more jobs in a 20-minute auto drive than a 60-minute transit trip. The latest data for 2021 reveal that the number of jobs reachable by transit or bicycle was about 9 percent greater in 2021 than 2019, but the number reachable by a 20-minute auto drive was 66 percent greater.

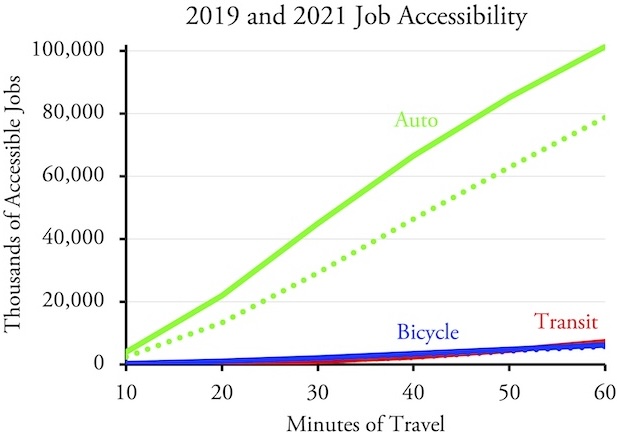
On average, over 50 urban areas and for trips of 10 to 60 minutes, auto users were able to reach 48 percent more jobs in 2021 than in 2019. Solid lines show 2021 and dotted lines show 2019.

These numbers are the average of the nation’s 50 largest urban areas, but for some the increased access caused by less traffic was much greater. In a 20-minute auto drive, residents of Atlanta, Boston, Los Angeles, San Francisco, San Jose, and Washington could reach more than twice as many jobs in 2021 than in 2019. Of course, jobs are only one possible set of destinations that became more accessible; other social and economic opportunities also became equally more accessible. Continue reading

Transit Carried 74.9% of 2019 Riders in November

America’s transit systems carried nearly 75 percent as many riders in November 2023 as the same month in 2019, according to data released on Friday by the Federal Transit Administration. This is the most riders transit has attracted, as a share of pre-pandemic levels, since the pandemic began in March 2020.

Transit’s failure to carry even three-fourths of its pre-pandemic passengers stands in contrast to Amtrak, which carried 3.1 percent more passenger-miles in November 2023 than 2019, and the airlines, which carried 4.3 percent more riders in November than in 2019. Release of airline passenger-mile data tends to be more than a month later than passenger numbers, but in September domestic air routes carried 6.0 percent more passenger-miles than the same month in 2019. November highway data are not yet available but an update will be posted here when they are. Continue reading

Pulling the Pin

I started this blog 17 years ago today and since then have put up nearly 4,000 posts. Today, I’m taking the next step towards retirement by ending my practice of posting nearly every weekday.

Is this the origin of the phrase “pulling the pin”? Maybe not but as a railfan it is nice to think so. Photo by Ben Franske.

I still have more posts planned. I’ve written two more major reports that I hope will be published soon and will post them here. I expect to continue monitoring new releases of transportation, housing, and census data and report on them here. I also need to write at least one more chapter in The Education of an Iconoclast. Continue reading

When the Economist Lost Its Way

Last week, the Economist published an article about when the New York Times lost its way. The article traces it to a June 2020 opinion piece by conservative U.S. Senator Tom Cotton that provoked such outrage among Times staffers that the editorial page editor, James Bennet, was forced to resign. Since Bennet now writes for the Economist, and in fact was the author of this article, it is easy to see why he would consider that incident to be a turning point for the Gray Lady.

In 2020, the Economist argued that countries should take advantage of the pandemic to enact draconian policies aimed at reducing climate change.

While it is easy to argue that the New York Times lost its way long before that incident, I have a different question: When did the Economist lose its way? The weekly magazine that calls itself a newspaper was founded 180 years ago based on the principles of free trade and free markets. Yet it seems to have forgotten those principles today, advocating for more and more government control of the world and national economies. Continue reading

Turning Colorado into Greenwich Village

The state of Colorado will celebrate its 150th birthday in 2026, and to celebrate the state’s Democratic governor, Jared Polis, has proposed what he thinks is a “visionary” land-use and transportation plan. In fact, it is just a tired old rehash of recent urban planning fads that are based on obsolete views of how people want to live.

Click image to download a 9.2-MB PDF of this 34-page report.

The plan is partly a repackaging of a bill the governor promoted in the last session of the state legislature that would have given cities housing targets and required them to build more multifamily housing to meet those targets. The bill was defeated thanks to strong opposition from city governments that didn’t want the state to preempt their zoning powers, but that didn’t sway Polis. Continue reading

The Rise and Fall of Bogotá’s Rapid Buses

The New York Times reviewed (non-paywall version) the ground-breaking bus-rapid transit system in Bogotá Columbia 23 years after it opened. The TransMilenio bus system first opened in December 2000 under fiscally conservative mayor Enrique Peñalosa and each route-mile is capable of moving more people per hour than New York City subways.

A high-capacity TransMilenio bus. Photo by Felipe Restrepo Acosta.

The system almost immediately doubled transit ridership, partly because the rapid buses were much faster than the buses they replaced but also because Bogota has a lot of low-income people who don’t own cars whose mobility was greatly enhanced by faster transit. Columbia had well under 200 motor vehicles per thousand people in 2000 (compared with more than 800 in the U.S.) and even today Columbia has fewer than 300 vehicles per thousand (compared with more than 900 in the U.S.). Whatever the reason, the rapid bus system carries up to 2 million riders a day, which is more than some U.S. light-rail lines carry in a year. Continue reading

MBTA’s State of Bad Repair

Back in 2003, the Massachusetts Bay Transportation Authority (MBTA) estimated it had a “state-of-good-repair” backlog of $2.3 billion (about $3.7 billion in today’s dollars). Proving that the people running the agency are incompetent, instead of fixing their backlog they decided to build a new 4.3-mile light-rail line that just happened to cost $2.3 billion.

One of MBTA’s light-rail trains. Although the MBTA operates several different light-rail lines, they are nearly all painted green and are known as the Green Line. Photo by Adam E. Moreira.

Congress became aware of the maintenance backlog for transit systems nationwide and since 2015 it has given out $26.65 billion in grants to fix tracks, vehicles, and stations. Problem solved, right? Continue reading

Evidence That Planners Are Dumb

The United States is not the only country where transit agencies are wildly spending on questionable projects that suffer huge cost overruns. In Canada, Toronto opened its first subway in 1954 at a cost of just $11 million per mile — $90 million per mile in today‘s U.S. dollars. The city is currently building a subway line that was supposed to cost almost US$1.0 billion a mile, but with cost overruns is expected to cost as much as US$1.4 billion a mile.

Toronto subway. Photo by Tim Adams.

Light rail in Canada has also undergone huge price inflation. Edmonton opened North America’s first modern light-rail line in 1978 at a cost of US$47 million a mile in today’s money. Today, Calgary, Hamilton, Kitchener, and Toronto are all planning or building light-rail lines that are expected to cost at least US$300 million a mile, and several of these have had cost overruns of as much as 180 percent. Continue reading

No Amount of Money Is Too Much

Is there any transit construction project that is so expensive that a transit agency will say, “Let’s not do this”? The Antiplanner has argued that the answer is “no”; instead, the only question agencies ask is, “Where are we going to get the money to do this?” Evidence for this view has recently come to light in San Francisco and Baltimore.

Architect’s model of the planned San Francisco transit center. Note the bottom level has commuter trains on the outer tracks and high-speed trains on the center tracks even though the prospects of high-speed rail ever reaching San Francisco are dimming every day.

Last January, I observed that the price of a 1.3-mile commuter-rail extension that San Francisco was planning had increased from $5.0 billion to $6.7 billion, or more than $5 billion a mile. I pointed out that there were several viable alternatives to spending what would be a record amount of money per mile on a transit project, including replacing the trains with buses or terminating the trains at a different location just seven minutes away. Now comes the news that the cost of the project has increased again to $8.25 billion, or more than $6.3 billion a mile. Continue reading

Transit Slowly Recovers

U.S. transit systems carried 73.9 percent as many riders in September 2023 as the same month in 2019, according to data released earlier this week by the Federal Transit Administration. This is transit’s highest level, as a percent of 2019 numbers, since the pandemic began. This is particularly remarkable as September 2023 had one less business day than September 2019.

Highway data for September 2023 are not yet available. This chart and post will be updated when they are released.

Transit was aided by the fact that September ridership in the New York urban area, where 46 percent of all transit rides take place, reached 78.6 percent of pre-pandemic numbers. Transit is also doing better than average in Los Angeles (79.3%), Miami (83.4%), Dallas (78.4%), and Houston (87.2%). Washington reached 73.8 percent, just slightly below the national average. Ridership continues to be below average in Chicago (63.1%), Philadelphia (59.4%), Atlanta (60.6%), Boston (64.0%), Phoenix (55.8%), and San Francisco-Oakland (64.4%), to name a few. Although transit ridership is slowly recovering, it is still well behind driving, which first reached 100 percent of pre-pandemic miles in June, 2021. Continue reading