Search Results for: rail projects

It Takes Money to Lose Money

Just before the pandemic, Amtrak proudly announced that it lost only $29.5 million operating passenger trains in 2019 and expected to make an operating profit in 2020. Of course, that didn’t happen thanks to the pandemic, and what’s more, it was lying about losing only $29.5 million; its actual losses were closer to $1.4 billion, a mere 46 times more than it claimed.

Amtrak spent $2.5 billion on new trainsets for its high-speed Acela. These were supposed to go into service in 2021 but are now expected to begin service no sooner than 2023. Photo by Fan Railer.

Now that Congress has flooded Amtrak with money in the infrastructure bill, however, the agency no longer even cares about whether its passenger trains come close to covering their costs. Like any good soviet agency, it recently released its five-year plan, and it projects it will lose more than a billion dollars a year for almost every year in the future. Continue reading

The Perils of Bus-Rapid Transit

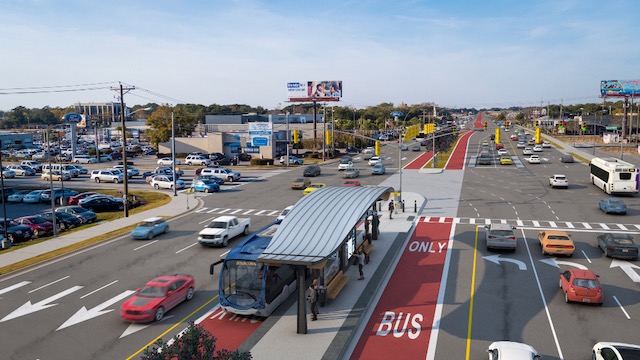
Ten years ago, the San Francisco Municipal Transportation Agency (Muni) decided to build a two-mile long busway on Van Ness Avenue, dedicating two lanes of the six-lane street exclusively to buses. The project was supposed to cost $125.6 million and make transit more attractive by speeding up buses. The planners’ calculations indicated that, without the project, buses would carry 50,800 transit riders a day. With the project, it would carry 52,400 riders, a 3.15 percent increase.

Van Ness before the busway. Click on image to see the original photo in Google street view.

The busway opened for business last week after more than a decade of planning and six years of construction. The final cost turned out to be $345.9 million, a mere 175 percent cost overrun. Ridership on Muni buses is currently about half what it was before the pandemic, and it will be a long time before the Van Ness route recovers to 50,800 riders a day, much less 52,400. Continue reading

Replacing One Bad Idea with Another

Seattle-area residents have got themselves into a real fix. They voted to impose numerous taxes on themselves to spend tens of billions of dollars building new light-rail lines to downtown Seattle. Now, cost have increased, Seattle transit ridership is down by 54 percent, and Amazon is moving workers out of downtown Seattle.

Now a group called SkyLink has proposed a solution: replace light rail with aerial gondolas. These would supposedly be higher in capacity, less expensive, and would require less displacement of homes and businesses. Continue reading

Transit Safety: A Matter of Design

Light rail is safe to ride, but it is one of the most dangerous forms of travel in the United States. That’s because most of the people who are killed by light-rail trains aren’t riding them; they are people struck by the trains. According to Federal Transit Administration (FTA) data, 657 fatalities have been associated with light rail since 2002, but only 20 of them were passengers on board the trains.

Click image to download a four-page PDF of this policy brief.

Counting all fatalities, light rail was associated with 15.9 deaths for every billion passenger-miles that it carried. This is much higher than most other transit modes: buses were 4.9; heavy rail was 5.6; commuter rail was 7.6; and streetcars were 11.6. The only mode more dangerous than light rail was what the FTA calls hybrid rail, which is really light rail but powered by Diesels instead of electricity. It was associated with 20.6 deaths per billion passenger-miles. Continue reading

A New Level of Transit Incompetence

It seems like we are getting more lessons about massive cost overruns for transit projects every couple of weeks. Last week, the Federal Transit Administration issued a “scathing report claiming that the Santa Clara Valley Transportation Authority (VTA) was being “overly optimistic” and “misleading” in its estimates of the costs of building a BART subway to San Jose.

Despite objections from critics, VTA decided to bore an 86-foot deep, 48-foot diameter tunnel rather than build two shallower and smaller tunnels using the cut-and-cover method, which would have been less expensive and saved passengers’ time.

The six-mile-long project was originally estimated to cost $5.6 billion (which is itself ridiculous) and be done in 2029, but the FTA now predicts it will cost as much as $9.1 billion and won’t be complete until 2034. This is $1.5 billion a mile for a transit line that is expected to carry so few riders that early estimates predicted it would cost more than $100 for each new transit rider carried. VTA’s response doesn’t refute anything the FTA said, but basically said it is too late to fix the problems so taxpayers would have to live with them (and pay for them). Continue reading

Truckers, Congestion, and Class Conflict

“During the pandemic lockdowns, the email jobs caste [meaning remote workers] loved to talk about essential workers,” observes Marxist writer Malcom Kyeyune, but they now regard those workers with “outright hatred.” His fellow leftists claim to speak for the working class, charges Kyeyune, but in fact the leftist movement and the working-class movement have “divorced.”

Click image to download a four-page PDF of this policy brief.

Kyeyune was writing about the Canadian truckers who object to mandatory vaccinations, but he also mentioned European truckers who protested high fuel taxes a few years ago. In the United States, middle-class progressives have come to depend on truckers to deliver all the stuff they order from Amazon but do everything they can to make the daily lives of those truckers miserable. Continue reading

BART Outlook Grim Because Managers Dim

The San Francisco Bay Area Rapid Transit District (BART) says that its financial outlook is “grim” and it may have to ask voters for a tax increase to keep running. As of December, BART was still carrying just 25 percent as many passengers as it carried before the pandemic.

BART spent nearly $2 million apiece on 775 of these railcars, which first went into service in 2018. In December 2020, BART halted delivery on the new cars because they were so unreliable.

In a presentation to the agency’s board of directors, staff noted that Congress had given $1.3 billion in COVID relief funds. It has used just about half of that and is burning through the rest at a rate of $25 million a month. At that rate, it has enough to keep going for about two more years. Continue reading

2021: The Year Transit Failed to Recover

Despite receiving tens of billions of dollars in support from Congress, the transit industry in 2021 failed to recover most of the riders it lost to the pandemic in 2020. Ridership in 2020 had fallen by 54 percent from 2019 due to the pandemic, and was only 3 percent greater, or 52 percent below 2019 numbers, in 2021, according to data released by the Federal Transit Administration last week.

Click image to download a four-page PDF of this policy brief.

Ridership did improve over the pandemic months of 2020, but not by much. The year 2020 ended with ridership at 38 percent of pre-pandemic levels. It reached 50 percent for the first time in July 2021, slowly climbed to 55 percent in September, and hovered around 55 to 57 percent for the rest of the year. Continue reading

Funding Obsolete Transportation

Urban transit carried less than half a percent of passenger-miles during the pandemic, yet received 65 percent of the COVID relief funds given by Congress to the Department of Transportation, says an article published last week by the American Institute of Economic Research. Similarly, Amtrak carried less than 0.05 percent of passenger-miles yet received 4.4 percent of DOT’s COVID relief funds. Meanwhile, zero COVID relief funds went to freight supply-chain systems, which proved to be the real transportation problem resulting from the pandemic.

The North Star commuter train. Photo by Jerry Huddleston.

Thanks to the influx of COVID relief funds, plus $40 billion more for transit in the infrastructure bill, transit agencies are seriously considering expansions of transit services that should be considered failures. For example, Minnesota’s North Star commuter train was expected to carry 3,600 riders per weekday in its first year of operation. It carried only 2,200 weekday riders in 2010, its first full year. By 2019, it was still only carrying 2,700 riders per weekday. Continue reading

November Transit Reaches 56.2% of Pre-Pandemic Riders

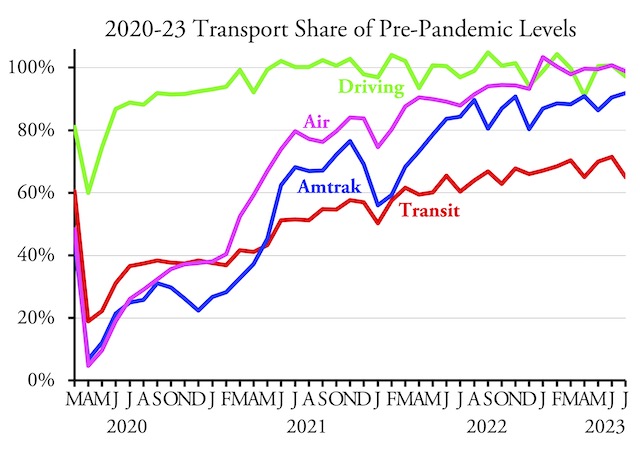
The nation’s transit systems carried 56.2 percent as many riders in November 2021 as in November 2019, according to data released by the Federal Transit Administration on Friday. Though an improvement over October’s 53.5 percent, transit still lags behind the airlines, at 84.0 percent, and Amtrak, at 76.6 percent.

Amtrak numbers from its Monthly Performance Report; airline numbers from the Transportation Security Administration; November highway numbers will be available in a week or so.

Transit bus ridership numbers were up to 60.5 percent of pre-pandemic levels while rail numbers reached 52.2 percent. Ridership has still failed to reach 50 percent of pre-pandemic numbers in Detroit (35.4%), San Francisco-Oakland (45.0%), Washington DC (45.5%), Sacramento (48.4%), San Jose (49.1%), and Chicago (49.8%). At the other extreme, ridership has recovered the most in Los Angeles (72.1%), San Diego (64.7%), Tampa-St. Petersburg (63.9%), Las Vegas (63.4%), Dallas-Ft. Worth (62.6%), Houston (61.2%), and San Antonio (60.6%). The New York urban area, which produces about 45 percent of all transit numbers in the U.S., was slightly above average at 58.3 percent. Continue reading