Search Results for: rail projects

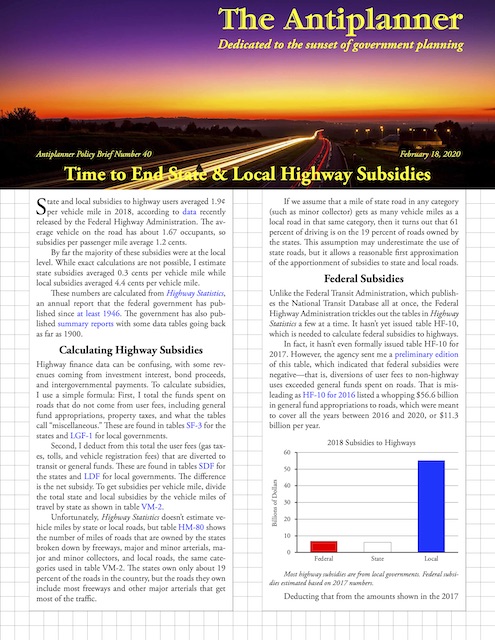
Time to End State & Local Road Subsidies

State and local subsidies to highway users averaged 1.9¢ per vehicle mile in 2018, according to data recently released by the Federal Highway Administration. The average vehicle on the road has about 1.67 occupants, so subsidies per passenger mile average 1.2 cents.

Click image to download a four-page PDF of this policy brief.
By far the majority of these subsidies were at the local level. While exact calculations are not possible, I estimate state subsidies averaged 0.3 cents per vehicle mile while local subsidies averaged 4.4 cents per vehicle mile. Continue reading

42. Visiting the Ideal Communist City

In December, 2004, France opened the Millau Viaduct, which by some measures is the largest bridge in the world. More than a mile-and-a-half long, supported by pylons that are as much as 1,100 feet tall, the bridge carries auto and truck traffic as high as 900 feet above the Tarn valley below, reducing the journey across the valley from many minutes to barely more than 60 seconds.

The bridge cost 394 million euros, well over half a billion dollars in today’s money. What was most interesting to me is that not a penny of public money went into construction (though some was spent on planning). Instead, this was a public-private partnership, meaning the public granted a private company, in this case a construction company called Eiffage, a franchise to build, operate, and collect tolls from users of the bridge. After a certain number of years, in this case 40 to 75 depending on the amount of tolls collected, ownership of the bridge reverts to the public. Continue reading

40. Preserving the American Dream

Sales of the Vanishing Automobile went really well. Although my publicity was limited to a web site and speaking engagements, it sold faster than my previous book, Reforming the Forest Service.

This made me realize that there was a lot of grassroots opposition to urban planning fads such as smart growth and light rail. To promote that opposition, I decided to bring experts and activists together in a national conference.

Previous conferences that I had held, such as the 1984 Mission Symposium, had been backed up by a staff of at least four or five other people. But I organized this conference, which I called Preserving the American Dream, by myself. Continue reading

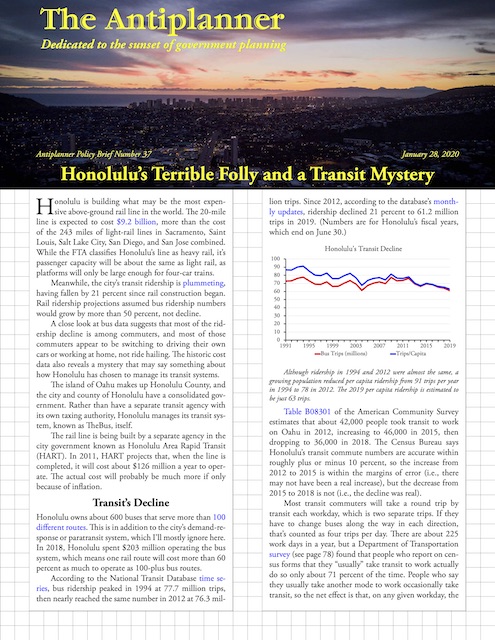
Honolulu’s Terrible Folly & a Transit Mystery

Honolulu is building what may be the most expensive above-ground rail line in the world. The 20-mile line is expected to cost $9.2 billion, more than the cost of the 243 miles of light-rail lines in Sacramento, Saint Louis, Salt Lake City, San Diego, and San Jose combined. While the FTA classifies Honolulu’s line as heavy rail, it’s passenger capacity will be about the same as light rail, as platforms will only be large enough for four-car trains.

Click image to download a four-page PDF of this policy brief.
Meanwhile, the city’s transit ridership is plummeting, having fallen by 21 percent since rail construction began. Rail ridership projections assumed bus ridership numbers would grow by more than 50 percent, not decline. Continue reading

St. Louis Streetcar Dies a Noisy Death

Built at a cost of $51 million, St. Louis’ streetcar line made its last run in December, 2019 when the organization operating it ran out of funds. Fittingly, it broke down on its very last run and its passengers had to walk the last few blocks of the route.

Built at a cost of $51 million, the trolley opened in November, 2018 after a decade of planning and construction. Proponents predicted it would carry 400,000 riders in its first year. In fact, it carried only about 20,000 and fare revenues didn’t come close to covering operating costs.

Streetcar lovers hoped that St. Louis’ regional transit agency, which can’t seem to decide whether to call itself Metro (the name used by numerous other transit agencies) or Bi-State (which is boring but at least original), would take over the streetcar. Last week, Bi-State’s CEO said he was prepared to take it over provided he could require every business along the line to buy a monthly pass for all of their employees. Continue reading

39. The West Is Burning! (Or Is It?)

While I was in transition from working primarily on public lands issues to working primarily on urban issues, the Forest Service was in transition from focusing primarily on timber to focusing on something else, but it wasn’t quite sure what. Chief Thomas suggested that it should focus on ecosystem management, but ecosystem management doesn’t pay the bills, especially since no one was quite sure what it meant.

My reform proposals called for the federal land agencies to be allowed to charge market prices for all resources and be funded exclusively out of a fixed share of those revenues. I suspected that, on most national forests, this would lead to recreation becoming the most important use, though there would still be room for timber and other uses. The main obstacle to this was that Congress didn’t allow the agencies to charge for most recreation.

That began to change in 1996 when Congress created the Recreation Fee Demonstration program, allowing each of the four main public land agencies (Forest Service, Park Service, BLM, and Fish & Wildlife Service) to begin up to 100 experiments with recreation fees each and letting the agencies keep the revenues. The Park Service approached this with a complete lack of innovation, instead merely increasing entrance fees on 100 parks that were already charging fees and keeping the increased income (the fees that were previously being collected went into the Land & Water Conservation Fund). Continue reading

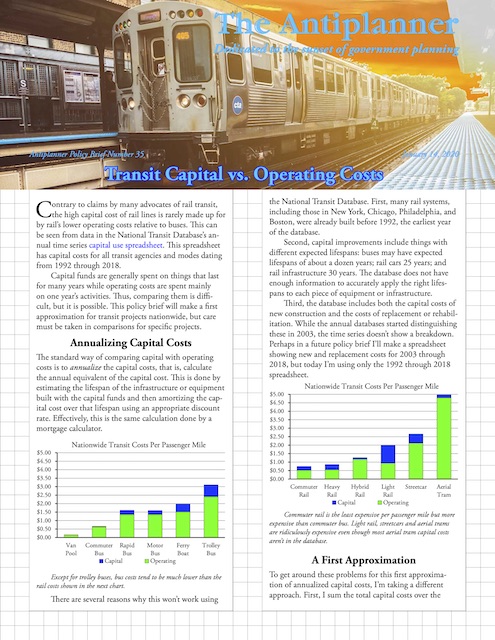
Transit Capital vs. Operating Costs

Contrary to claims by many advocates of rail transit, the high capital cost of rail lines is rarely made up for by rail’s lower operating costs relative to buses. This can be seen from data in the National Transit Database’s annual time series capital use spreadsheet. This spreadsheet has capital costs for all transit agencies and modes dating from 1992 through 2018.

Click image to download a four-page PDF of this policy brief.
Capital funds are generally spent on things that last for many years while operating costs are spent mainly on one year’s activities. Thus, comparing them is difficult, but it is possible. This policy brief will make a first approximation for transit projects nationwide, but care must be taken in comparisons for specific projects. Continue reading

34. The Forest Options Group

In the mid-1990s, that portion of the timber industry that depended on federal timber sales was on the ropes. National forest timber sales had declined from 11 billion board feet in 1989 to less than 3 billion in 1995. Mills that had bought most of their timber from the national forests for the previous five decades were hard pressed to find alternate sources of wood.

So perhaps it wasn’t surprising that timber industry representatives were eager to talk with environmentalists about finding common ground for reforming the Forest Service. Nor was it surprising that environmentalists were reluctant to talk; after all, they were winning, so any talks that might lead to a compromise seemed to be unnecessary.

But I wasn’t a typical environmentalist, and as the term was defined by the “progressives” in 1995, maybe I wasn’t an environmentalist at all. I was less interested in “total victory” than I was in getting the answer right. How much was the right amount of timber to be cut from federal lands? What was the right amount of wilderness? What was the proper balance between clearcutting vs. selection cutting given their differing impacts on wildlife, watershed, and other resources? Continue reading

33. Winning the Battles, Losing the War

After winning the battle of Oak Grove, I wanted to help other neighborhoods in the Portland area that were facing similar densification plans. One of the first things I did was call a meeting of people who were fighting densification in their own neighborhoods. Quite a large number of people showed up, and the group decided to call itself Ortem, which was Metro spelled backwards. Ortem never became very powerful but it did help people throughout the region network together and get access to resources and expertise.

About this time, two students from the Maxwell School of Public Affairs at Syracuse University came to Portland to work for me as interns. I hadn’t looked closely at Portland’s light-rail system, so I asked them to study it. Their first response was, “We love light rail!” I told them to look at it with an open mind.

They came back a week or so later and announced, “It’s awful!” They had interviewed some critics who convinced them that it was a huge waste of money. It cost far more than buses and most of the people riding it were former bus riders. In fact, the share of Portland-area residents taking transit to work dramatically dropped after Portland’s transit agency, TriMet, built light rail because it had to cut bus service and raise bus fares to help pay for rail cost overruns. Continue reading

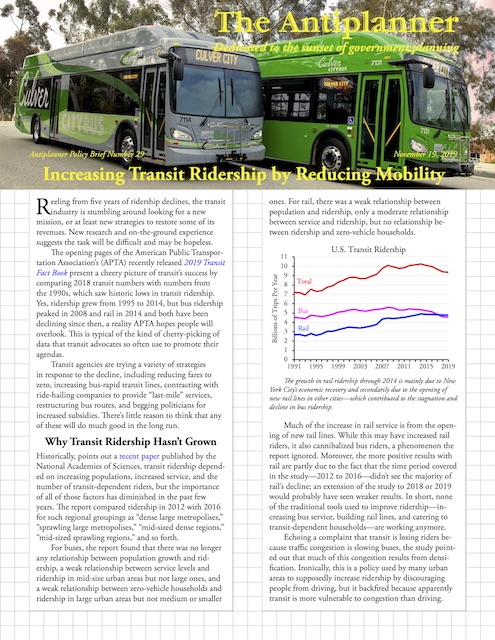
Reducing Mobility to Boost Transit

Reeling from five years of ridership declines, the transit industry is stumbling around looking for a new mission, or at least new strategies to restore some of its revenues. New research and on-the-ground experience suggests the task will be difficult and may be hopeless.

Click image to download a four-page PDF of this policy brief.

The opening pages of the American Public Transportation Association’s (APTA) recently released 2019 Transit Fact Book present a cheery picture of transit’s success by comparing 2018 transit numbers with numbers from the 1990s, which saw historic lows in transit ridership. Yes, ridership grew from 1995 to 2014, but bus ridership peaked in 2008 and rail in 2014 and both have been declining since then, a reality APTA hopes people will overlook. This is typical of the kind of cherry-picking of data that transit advocates so often use to promote their agendas. Continue reading