Search Results for: rail

32 Years of Transit Data

When the Federal Transit Administration released the 2022 National Transit Database, it also released updated time series data tables. These tables have operating data (including costs and ridership) from 1991 through 2022, capital costs from 1992 through 2022, and fare revenues from 2002 through 2022.

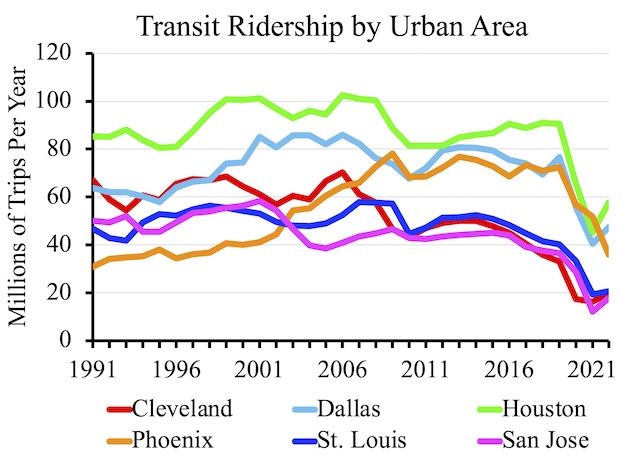
This chart shows ridership for six urban areas that I consider to be basket cases, with ridership steadily declining despite — or more likely because of — the construction of light-rail or some other transit infrastructure. Of course, ridership declined everywhere due the pandemic, but most of these are among the slowest to recover to their already low 2019 levels.

The release includes six data tables, but I find just two of them useful as they are the only two that break down data by mode. Table TS3.1 has capital costs by transit agency and mode. Table TS2.1 has all other information — operating costs, fares, service in miles and hours, ridership, passenger-miles, and miles of rail lines — by agency and mode. Continue reading

Betteridge’s Law Applies Here

“Will Twin Cities to Duluth train succeed where it once failed?” asks a headline from a St. Paul news station. As Betteridge’s law of headlines states, “Any headline that ends in a question mark can be answered by the word no,” and I’m pretty sure that applies here.

Should Minnesota’s failed commuter train be supplemented by a failed intercity passenger train? Photo by Jerry Huddleston.

There are exceptions to Betteridge’s law, of course. For example, this 2019 headline, “Could the Commuter Rail from Minneapolis to Duluth be a Flop?” poses the same question in the opposite direction. One of the two headlines violates Betteridge’s law. My money is on the law applying to the first but not the second. Continue reading

2022 National Transit Database

Last year, Americans took about 6 billion trips on transit covering about 30 billion passenger-miles, according to the 2022 National Transit Database, which the Federal Transit Administration released late last week. This was about 61 percent as many trips and 56 percent as many passenger-miles as in 2019. Annual numbers in the National Transit Database are based on transit agency fiscal years and will not agree with calendar year numbers.

Portland’s transit mall has both buses and light rail; it’s worth noting that adding light-rail to the mall reduced the number of people that the mall could move per hour. Photo by Steve Morgan.

The 2022 database comes in the form of 29 different spreadsheets. To simplify it, I have collapsed these into a single spreadsheet that contains that data I find most useful for every transit agency and mode of transit. These data include trips, passenger-miles, service (in VRM or vehicle-revenue-miles and VRH or vehicle-revenue-hours), average weekday ridership, fares (including fares paid by riders and fares paid by organizations), operating costs, capital costs (including costs for existing service and costs for expanded service, plus unspecified costs for smaller agencies), number of vehicles, number of seats, amount of standing room, and revenue rail miles. Continue reading

Brightline’s Orlando Route Claims First Victim

The good news is that it took a month before a Brightline train on its new Orlando route killed a pedestrian. The bad news is that it did so in the same circumstances as previous fatalities south of West Palm Beach: a busy railroad crossing with inadequate crossing gates that previously saw only a few slow freight trains per day now populated with frequent fast passenger trains.

The crossing where a pedestrian was killed by a Brightline train last week is shown in this Google street view. Note that crossing gates only block the right side of the road, so pedestrians on the left side are not prevented from crossing tracks when gates are down.

This isn’t part of the route that was built new but an existing freight line that is being used by Brightline trains. When Brightline introduced fast passenger trains to a corridor previously used by slow freight trains, it should have installed better gate crossings. Instead, all it did was issue “ public service announcements on railroad safety that emphasized when the arms go down, don’t go around.” Since, as the photo above shows, the arms don’t completely block the sidewalks when they go down, that’s not very useful advice. Brightline’s failure to add better crossing gates despite the high number of deaths in the Miami-West Palm Beach corridor shows its callous disregard for people’s safety. Continue reading

HSR: An Idea Whose Time Has Gone

The Mineta Institute — named after a San Jose congressman who was Secretary of Transportation in 2001 through 2006 — has a new report claiming that high-speed rail will produce huge economic and environmental benefits. Rather than being based on any careful analyses, it basically repeats old claims that are even less valid today than when they were first made.

Click image to download a 3.1-MB PDF of this report.

For example, the report cites the California High-Speed Rail Authority’s claim that rail construction “has generated an estimated 74,000 to 80,000 job years, $5.6 to $6.0 billion in labor income, and $15 billion to $16 billion in economic output between 2006 and 2022.” That’s like saying that buying a $100,000 car generates $100,000 in income. It might be income for someone, but for the person buying, the $100,000 is a cost, not a revenue. Continue reading

Indonesia $7.3B Debt for an Archaic Train

At least one passenger is thrilled that a high-speed train that began operating earlier this month has reduced train travel times from Bandung to Jakarta, Indonesia, from 3 hours to 44 minutes. The rail line uses Chinese technology and was financed by China under that country’s belt-and-road initiative.

Indonesia’s high-speed train on a test run before the October 2 inauguration. Photo by Muhammad Bintang Nurandi Putra.

Although the train has a top speed of 210 miles per hour, the rail distance between the two cities is only 88 miles, so the average speed is only 120 miles per hour. The rail line cost $7.3 billion, which was $1.2 billion more than the original projection. At $83 million per mile, that’s comparable to the cost of the high-speed rail line being built in California, thus defying arguments that high-speed rail can be built at a much lower cost. Continue reading

Proven to Be an Expensive Way to Reduce Ridership

Light rail is a “proven technology,” claims Atlanta Beltline engineer Shaun Green, so there is no need to look at alternatives to spending a couple of billion dollars or so building a 22-mile light-rail and streetcar loop around the city. He was responding to some local residents who think that alternatives should be considered because “rail is the 20th century.”

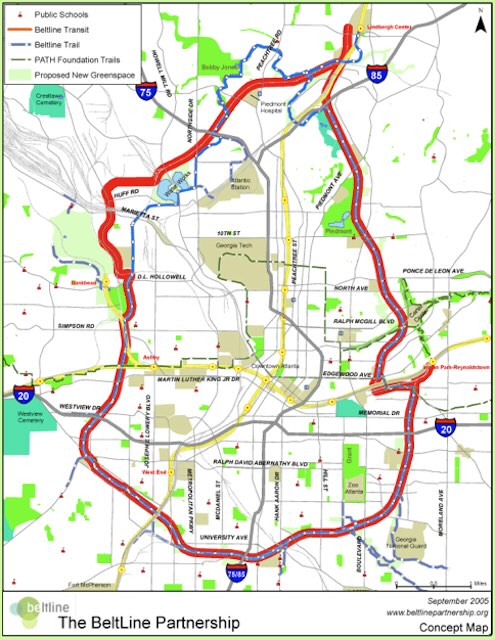
Proposed route of Atlanta beltline transit system.

It is sad that even trained civil engineers have lost the simple analytical skills needed to handle questions like this. Let’s look and see where light rail has proven itself. Continue reading

Driverless Buses in Abu Dhabi

Abu Dhabi, the capital of United Arab Emirates, has begun operating a bus-rapid transit system with a couple of twists. First, the buses are gigantic: with two trailers (illegal in most U.S. cities), they can easily hold 200 passengers and squeeze in 240. Second, they will be completely automated despite using existing infrastructure. Some videos show a driver at the wheel, but I presume this was solely during a trail period.

The battery-powered buses operate over a 27-kilometer route with about one station per kilometer. The city of Abu Dhabi consists of several islands, and the buses connect Abu Dhabi island with Yas Island, a major tourist center. Because the buses are oriented around tourists, for now they only operate on Fridays, Saturdays, and Sundays. Continue reading

Fixing MBTA’s Financial Mess

Boston’s transit agency, the Massachusetts Bay Transportation Authority (MBTA or T for short), appears to be on the verge of collapse. Eight years ago, it reported a $7.3 billion repair backlog, which has probably grown since then. As I read its 2022 financial statement, it also has $5.4 billion in unfunded pension and health care liabilities.

No one was particularly surprised when an Orange Line train caught fire last year. Photo by Marissa Babin.

State officials have known about the T’s serious maintenance and safety problems at least since 2009, when an outside report commissioned by the governor found that it had a $3 billion maintenance backlog and wasn’t even spending enough on maintenance to keep that backlog from growing further (which is why it grew to $7.3 billion six years later). This was creating serious safety problems, the report charged, finding that the agency’s maintenance program was addressing only about 10 percent of the system’s most serious safety issues. Continue reading

Changing the Game for the Worse

A 3/4-cent sales tax increase for transit is “seen as a game-changing model to fund transit service — and the envy of many cities nationwide,” reports the Minneapolis Star Tribune. What the article doesn’t say is how the tax will change the game for the worse for transit riders and transportation users in general.

Twin Cities transit ridership had been going downhill before the pandemic, declining nearly 10 percent between 2015 and 2019. Photo by Metro Transit.

What this means is that Metro Transit will no longer care about ridership numbers. Instead, it can freely spend hundreds of millions of dollars a year on projects that do little to generate ridership with no repercussions. Continue reading