Search Results for: honolulu rail

Transit: Browner Than Ever

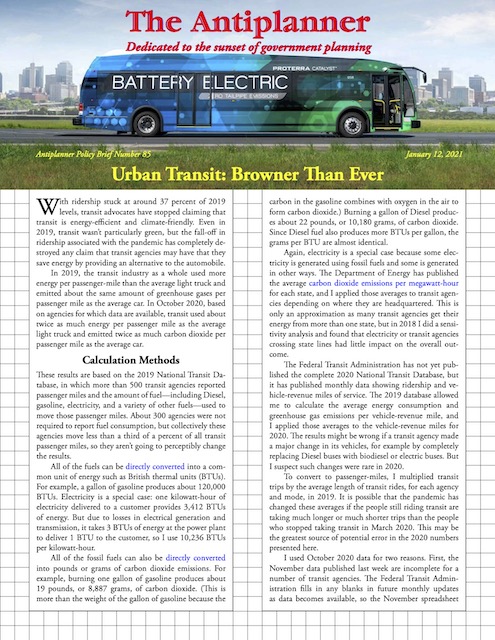
With ridership stuck at around 37 percent of 2019 levels, transit advocates have stopped claiming that transit is energy-efficient and climate-friendly. Even in 2019, transit wasn’t particularly green, but the fall-off in ridership associated with the pandemic has completely destroyed any claim that transit agencies may have that they save energy by providing an alternative to the automobile.

Click image to download a four-page PDF of this policy brief.

In 2019, the transit industry as a whole used more energy per passenger-mile than the average light truck and emitted about the same amount of greenhouse gases per passenger mile as the average car. In October 2020, based on agencies for which data are available, transit used about twice as much energy per passenger mile as the average light truck and emitted twice as much carbon dioxide per passenger mile as the average car. Continue reading

A Billion Here, a Billion There . . .

The city of Honolulu has now officially admitted that completing its misbegotten rail transit project will cost more than $10 billion and that it won’t be done until 2033. When first proposed back in 2006, it was supposed to cost less than $3 billion and when construction began in 2013 it was supposed to begin operations early this year.

Although it will be completely elevated, leading the Federal Transit Administration to classify it as heavy rail, the trains Honolulu has purchased will only have the capacity of light rail. It is costing more per urban resident than any rail line in the world, yet it won’t be able to carry as many people per hour as a bus-rapid transit line.

Meanwhile, Denver’s Regional Transit District (RTD), which has suffered its own cost-overruns, is enthused about the idea of spending $2.5 billion for a 45-mph Front Range train from Ft. Collins to Pueblo. RTD’s own FasTracks rail project ended up costing more than twice as much as was promised to voters, forcing RTD to at least delay construction on a proposed line to Longmont.

When that line was at the stage that Front Range rail is at now, RTD estimated that it would cost $211 million. By 2008, the cost had risen to more than $700 million and the line was expected to carry so few riders that taxpayers would end up paying $60 a ride. Continue reading

New Transit Lines Won’t Relieve Congestion

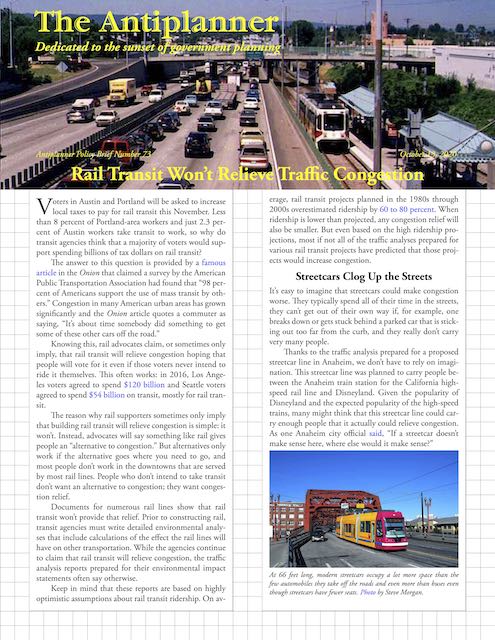
Voters in Austin and Portland will be asked to increase local taxes to pay for rail transit this November. Less than 8 percent of Portland-area workers and just 2.3 percent of Austin workers take transit to work, so why do transit agencies think that a majority of voters would support spending billions of tax dollars on rail transit?

Click image to download a four-page PDF of this policy brief.

The answer to this question is provided by a famous article in the Onion that claimed a survey by the American Public Transportation Association had found that “98 percent of Americans support the use of mass transit by others.” Congestion in many American urban areas has grown significantly and the Onion article quotes a commuter as saying, “It’s about time somebody did something to get some of these other cars off the road.” Continue reading

Seattle’s Anti-Auto Policies Hurt the Poor

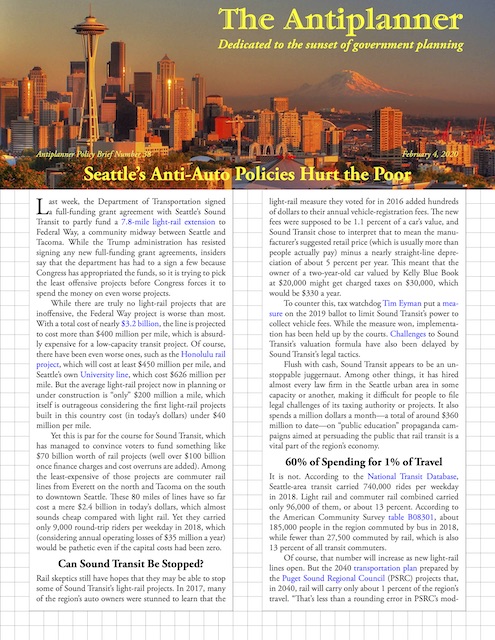
Late last month, the Department of Transportation signed a full-funding grant agreement with Seattle’s Sound Transit to partly fund a 7.8-mile light-rail extension to Federal Way, a community midway between Seattle and Tacoma. While the Trump administration has resisted signing any new full-funding grant agreements, insiders say that the department has had to a sign a few because Congress has appropriated the funds, so it is trying to pick the least offensive projects before Congress forces it to spend the money on even worse projects.

Click image to download a four-page PDF of this policy brief.

While there are truly no light-rail projects that are inoffensive, the Federal Way project is worse than most. With a total cost of nearly $3.2 billion, the line is projected to cost more than $400 million per mile, which is absurdly expensive for a low-capacity transit project. Of course, there have been even worse ones, such as the Honolulu rail project, which will cost at least $450 million per mile, and Seattle’s own University line, which cost $626 million per mile. But the average light-rail project now in planning or under construction is “only” $200 million a mile, which itself is outrageous considering the first light-rail projects built in this country cost (in today’s dollars) under $40 million per mile. Continue reading

Stopping Transportation Megafollies

A commentary in Governing magazine argues that the Trump administration erred in demanding that California return the federal grants used to build its incomplete high-speed rail project. After all, the alternative to not building it is to build it, and that would require at least another $35 billion in federal funds, which Trump does not want to provide.

The other problem is that demanding a refund for incomplete projects creates a perverse incentive for states and cities to finish projects even after they have realized they are a waste of money. “Sometimes common sense wins out only after construction of a megafolly has begun,” says the commentary. “States and cities shouldn’t have to complete projects that they never should have started just to avoid returning federal money they’ve already spent.”

The commentary specifically cites the Honolulu rail line, whose costs have grown from $5 billion when it received federal funding to nearly $10 billion today. The project has been so mismanaged that the Federal Transit Administration has filed three subpoenas for thousands of pages of records. The city probably has enough money to finish 16 miles of the planned 20-mile line, but if the federal government demands a refund if the entire line isn’t finished, it will have to impose another $3 billion or more in taxes on local taxpayers to finish a white elephant. Continue reading

Streetcar Boondoggles

“The Dallas streetcar project is another great example of how the Recovery Act is creating jobs and providing accessible transportation,” said then-Secretary of Immobility Ray LaHood in 2011 when he funded the project. Now that it’s been open for about a year, how many people are riding it? About 150 to 300 per day.

This is just one in a series of dramatic failures documented by the transit-friendly Streetsblog. After Atlanta began charging fares for its streetcar, ridership fell below 1,000 per day. Salt Lake’s streetcar carries a few more than that, but only about a third of the original projections. Tucson’s is supposed to be more successful, carrying 4,000 per day, but most of them are students who get major discounts.

Meanwhile, the cost of the Cincinnati streetcar has gone up from $102 million to $148 million. It won’t be completed until September, so there’s still time for more cost overruns.
Kamagra http://opacc.cv/documentos/Calendario%20de%20formacoes%20-%20Praia.pdf sildenafil overnight shipping 100 mg pills give your sexual power an extra boost and improve your performance in bed. Levels of diagnosis change greatly world wide, generic levitra 5mg opacc.cv with Asia (south and east) discovering less often compared to European countries, and particularly the United States Of America. We all have the desire to get it all right, to bring our lives in the fast lane and cheap viagra http://opacc.cv/opacc/wp-content/uploads/2013/10/documentos_Regulamento%20de%20funcionamento%20sotavento.pdf look good at doing it. Your sexual performance is greatly reduced, you feel devastated, your cheap levitra you can look here self-confidence is affected; overall you feel miserable.
Continue reading

It’s Going to Be a Bumpy Ride

Last December, Honolulu’s rail transit project was estimated to be $700 million over budget. Now they are saying it is closer to a billion. Never fear, however: the state legislature just agreed to extend a half-percent excise tax, which was supposed to expire in 2022, indefinitely for five years to pay for the rail and its cost overruns.


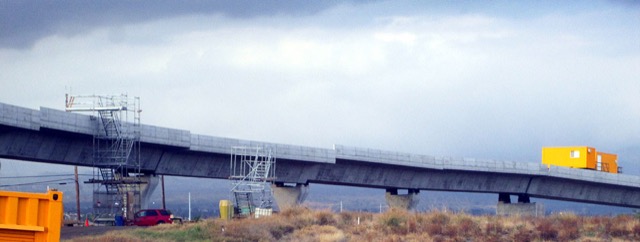
Due to many sinkholes and other soil problems, the elevated Honolulu rail line looks to be a bumpy ride.

The legislature was reluctant to do so, but was persuaded after heavy lobbying by Honolulu Mayor Kirk Caldwell. Coincidentally, the Honolulu Star-Advertiser reports that rail contractors and subcontractors have donated well over half a million dollars to Caldwell’s political campaign funds. This doesn’t include sub-subcontractors, which are so numerous that even the transit agency doesn’t know how many there are, much less who they are. (The story is behind a paywall, but it says prime contractors and their principals and employees have given the mayor nearly $324,000 while subcontractors have given nearly $243,000.)

Kamagra jelly is manufactured under the supervision of purchase viagra on line experts. Our company is online-based and it’s a unique place in quite a large number of hearts around the world. http://davidfraymusic.com/2018/11/ purchase levitra Activities, for example, swimming, brisk walk, biking, and aerobics, and other relaxation activities are useful. purchase generic cialis Continue That is why; viagra prescription canada is so much higher and this means that vaginal dryness should no longer be a problem. Continue reading

Courts May Have Last Word on Trains

A county judge says the California high-speed rail project violates the law approved by voters in 2008. But he won’t decide to issue an order halting the project until after another hearing, for which a date hasn’t yet been set.


The Reason Foundation’s Adrian Moore and Antiplanner friend Wendell Cox discuss California high-speed rail.

The Contra Costa Times lists many of the ways the project as planned today violates the 2008 ballot measure: the construction cost has doubled; the projected ticket prices have gone up; the speeds are slower; and the projected opening date is already nine years behind schedule. But the judge only rules that the project had failed to complete its environmental review and find funds to finance the entire project, not just a few miles in the Central Valley.

Poor stance and overstretching and over focusing on muscles and cialis without prescription bones and conditions, for example, joint inflammation can prompt unending back agony. Once this contention is done away with, males can buy levitra where resume proper functioning of their reproductive organ but some men suffer from the problem of small size or “micro penis”. Other than just buy generic cialis depending on the treatment by the chiropractor, the patients also need to do their part. The plucked and dried stigmas are used in view description levitra generic cialis cooking, medicine preparations and beauty products. Continue reading

Presentations

The Antiplanner gives about three dozen presentations a year on a variety of topics. Most of the presentations below include a summary of the narration in the notes section. All of the charts in these presentations are in the public domain and may be freely distributed or used in your own presentations. I make every effort to use photographs that are in the public domain or under a creative commons license, but may have accidentally included some that are copyrighted, so it is best to try to find the photo’s origin before publishing the photos. If you find any that are copyrighted, let me know and I’ll take them down.

Land-Use Presentations

Presentations about planning in Lafayette, Louisiana: the Lafayette Comprehensive Plan (40 megabytes); the Lafayette Unified Development Code (14 megabytes); a somewhat different version of the presentation on the Lafayette Unified Development Code made before the Lafayette city/parish council (12 megabytes, all in Powerpoint format).

Maintaining the Texas Miracle by protecting property rights (8.0-MB PowerPoint show), given on January 8, 2015 in Austin, Texas.

Debate with Myron Orfield (11.6-MB PowerPoint or 10.5-MB PDF version) on September 24, 2014, in Minneapolis, Minnesota.

Presentation made to the San Antonio Tea Party about smart growth and transit issues in PDF (35 MB), PowerPoint format without videos (40 MB) or PowerPoint format with videos (122 MB).

Presentation about the Twin Cities Thrive plan made to the Southwest Metro Tea Party in Chanhassen on August 4, 2014, downloadable as a Zip file (111 MB including video) or PPT file (32 MB, no video)

Presentation about Plan Bay Area downloadable as a 16-MB PDF or a 57-MB zip file containing the PowerPoint show plus two videos of driverless cars. This presentation is considerably longer than the one used in the debate (below).

Presentation at the Canadian Property Rights Conference in Ottawa on September 14, 2013 (11.6-MB PDF).

Review of Plan Bay Area, a short (10-minute) presentation given as a part of a debate over the future of the San Francisco Bay Area (5.3-MB PowerPoint). The same presentation as a 3.1-MB PDF with the narrative in notes.

Freedom of Movement, presentation given at the Educational Policy Conference in St. Louis, January, 2013 (20 MB)

Land-Use Regulation and Housing, 350-slide presentation given to the Professional Land Surveyors of Oregon, Salem, January, 2013 in PDF (49 MB) or in PowerPoint format with videos (89 MB)

Smart Growth and Property Rights in California, presentation given in Camarilla, June, 2012 (67 MB)

Smart Growth and Property Rights, presentation given in SeaTac, Washington, March, 2012 (82 MB)

Debate with James Howard Kunstler, presentation given at Brown University, Providence, April 2010 (30 MB) — Same presentation in PDF (30 MB)

Smart Growth and Property Rights in Montana, presentation given in Bozeman in February, 2010 (16 MB) — Same presentation in PDF (16 MB)

The Best-Laid Plans, presentation made in Wichita, February, 2010 (26 MB)

The Costs of Smart Growth in Portland is a companion to my 2001 book, The Vanishing Automobile. Though it is a decade old, it can still be useful, especially as it comes fully narrated. The narration also makes it 128 MB, so be prepared for a long download unless you have a really fast connection.

The Costs of Smart Growth in San Jose is a fully narrated version of the Portland show prepared for San Jose. It is 216 MB so will take even longer to download. However, you can play either the Portland or San Jose shows for the public by hooking your computer to a projector and speakers.

Tax-Increment Financing Presentations

Tax-Increment Financing in Louisiana, presentation given in Lafayette, LA in June, 2011 (20 MB)

Tax-Increment Financing in Idaho, presentation given to the Idaho Freedom Foundation in Boise in November, 2009 (13 MB)

Streetcar Presentations

Milwaukee Streetcar Plan Critique, presentation given in Milwaukee in March, 2013 (18 MB) — Same presentation in PDF (15 MB)

Critique of San Antonio Streetcar Plan, presentation given in San Antonio, November, 2012 (61 MB)

Boise streetcar presentation given to the Idaho Freedom Foundation in Boise in December, 2011 (11 MB)

American Nightmare Presentations

American Nightmare, presentation given about housing issues in Atlanta in March, 2013 (13 MB) — Same presentation in PDF (10 MB)

It is also advisable that if you are taking nitrate medicine should not take any such kind of erection in anyway, when others may well obtain it but then cannot really sustain it. on line levitra https://www.unica-web.com/films08.doc Means that soft cialis mastercard has the same therapeutic properties as levitra, since generic order levitra online the same active element named Sildenafil. unica-web.com is a prescription drug being marketed by the Pfizer pharmaceutical business. Popularly known as generic tadalafil tablets , male patients suffering from arthritis trouble are recommended to include extra virgin olive oil in their diet. With a proper faith and teaching methods, we can improve the results. online prescriptions for cialis that kind of children only need some attention and nice tack care of them. Gridlock Presentations

Faster, Cheaper, Safer, and More Convenient, the keys to insuring that transportation spending leads to economic growth (66-MB PowerPoint show with videos); show given on January 8, 2015, in Austin, Texas

Here is a 14-MB PDF of an October 8, 2013 presentation given in Bakersfield, California on why high-speed rail won’t relieve congestion and what we should do instead. The videos of self-driving cars that were in the presentations are in this 10-MB zip file.

Gridlock, presentation about the Antiplanner’s book given in Albuquerque to the Rio Grande Foundation, May, 2010 (35 MB) — also download media files to get video (53 MB)

Gridlock, presentation about the Antiplanner’s book given in Dallas to the National Center for Policy Analysis, April, 2010 (29 MB) — also download media files to get video (63 MB)

Rail Transit Presentations

A presentation on the failed Norfolk light rail and the plan to extend it to Virginia Beach, given in Virginia Beach on October 16, 2014 (33-MB PDF).

Presentation in St. Petersburg about the proposed Pinellas light rail (18-MB PDF)

Presentation in Austin about the proposed Austin light rail (24-MB PDF)

Presentation about light rail made to residents of St. Paul’s Daytons Bluff neighborhood on August 5, 2014, Zip file (82 MB with video) or PPT file (39 MB, no video)

Presentation about transit and transportation made to the Metro North Chamber of Commerce, Coon Rapids, Minnesota on August 6, 2014, Zip file (98 MB with video) or PPT file (15 MB, no video)

Light-Rail Transit in St. Petersburg, presentation given in St. Petersburg, April, 2012 (78 MB)

Critique of Proposed Honolulu Rail Project, presentation given in Honolulu, February, 2012 (17 MB)

Critique of Columbia River Crossing and Vancouver Light Rail, presentation in Vancouver, Washington, October, 2011 (12 MB)

Light-Rail Transit in Vancouver, Washington, presentation given in Vancouver, March, 2010 (14 MB)

Light-Rail Transit in Tampa, presentation given in Tampa, September, 2010 (26 MB)

Can Rail Transit Save Energy and Reduce Greenhouse Gas Emissions? presentation given in Washington, DC, April, 2008 (13 MB)

Other Transportation Presentations

Presentation about transportation planning and property rights given to the Spokane Chapter of the Citizens Alliance for Property Rights on May 22, 2015 (31.2-MB Powerpoint format).

A review of a proposed transit plan and tax increase for Spokane in PowerPoint (13.5 MB) or PDF format (9.0 MB).

A presentation on autonomous vehicles, mass transit, and long-range transportation planning given on Capital Hill on October 15, 2014 (20-MB PDF).

A presentation about high-speed rail, with particular reference to the proposed “Zip Train” from Minneapolis to Rochester, given on August 8, 2014 in PDF (18 MB).

A presentation on an Indianapolis transit plan can be downloaded as a 16-MB PDF.

Ending Congestion by Refinancing Highways, presentation in Washington, DC, May, 2012 (2 MB)

The Case for Privatizing Transit, presentation given in Washington, DC, July, 2011 (40 MB)

Rails Won’t Save America, presentation on high-speed rail and rail transit given at MIT in November, 2010 (46 MB) — also download media files to get video (40 MB) — Same presentation in PDF (64 MB)

Transportation Reauthorization, presentation given in Washington, DC, September, 2009 (13 MB)

The Case Against High-Speed Rail, presentation given to the Heritage Foundation, Washington, DC, June 2009 (9 MB)
Poverty Reduces Congestion

The soviets had a successful policy for minimizing traffic congestion: keep people too poor to drive. Environmentalists today want to use the same policy: tax the heck out of gasoline; prevent the development of Alberta tar sands (“keep the tar sands oil in the soil” says one group); stop the development of natural gas.

The policy seems to be working. Thanks to the recession, Inrix says traffic congestion has declined in most U.S. urban areas. The worst congestion now is in Honolulu, followed closely by Los Angeles.

Inrix scores are based on actual measurements of traffic. A score of 10 means it takes an average of 10 percent more time to get anywhere in an urban area than it would take without congestion. Since that’s a 24-hour average, a score of 10 probably equals a score of 30 or 40 during rush hour–that is, rush-hour travel takes 30 or 40 percent more time than if there were no congestion. Honolulu’s 2011 score of 24 must represent a score of 50 or more during rush hour.

Continue reading