Voters in Austin and Portland will be asked to increase local taxes to pay for rail transit this November. Less than 8 percent of Portland-area workers and just 2.3 percent of Austin workers take transit to work, so why do transit agencies think that a majority of voters would support spending billions of tax dollars on rail transit?
 Click image to download a four-page PDF of this policy brief.
The answer to this question is provided by a famous article in the Onion that claimed a survey by the American Public Transportation Association had found that “98 percent of Americans support the use of mass transit by others.” Congestion in many American urban areas has grown significantly and the Onion article quotes a commuter as saying, “It’s about time somebody did something to get some of these other cars off the road.”
Knowing this, rail advocates claim, or sometimes only imply, that rail transit will relieve congestion hoping that people will vote for it even if those voters never intend to ride it themselves. This often works: in 2016, Los Angeles voters agreed to spend $120 billion and Seattle voters agreed to spend $54 billion on transit, mostly for rail transit.
The reason why rail supporters sometimes only imply that building rail transit will relieve congestion is simple: it won’t. Instead, advocates will say something like rail gives people an “alternative to congestion.” But alternatives only work if the alternative goes where you need to go, and most people don’t work in the downtowns that are served by most rail lines. People who don’t intend to take transit don’t want an alternative to congestion; they want congestion relief.
Documents for numerous rail lines show that rail transit won’t provide that relief. Prior to constructing rail, transit agencies must write detailed environmental analyses that include calculations of the effect the rail lines will have on other transportation. While the agencies continue to claim that rail transit will relieve congestion, the traffic analysis reports prepared for their environmental impact statements often say otherwise.
Keep in mind that these reports are based on highly optimistic assumptions about rail transit ridership. On average, rail transit projects planned in the 1980s through 2000s overestimated ridership by 60 to 80 percent. When ridership is lower than projected, any congestion relief will also be smaller. But even based on the high ridership projections, most if not all of the traffic analyses prepared for various rail transit projects have predicted that those projects would increase congestion.
Streetcars Clog Up the Streets
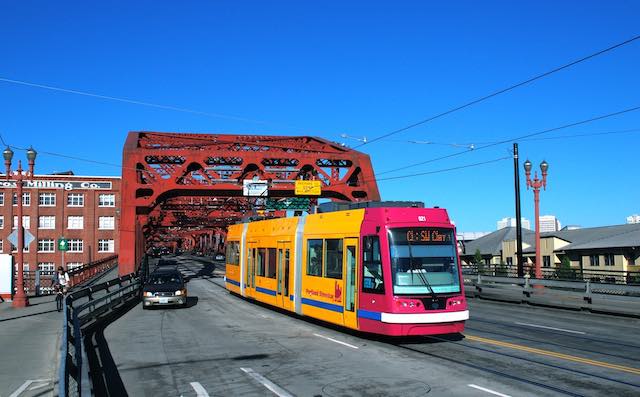
It’s easy to imagine that streetcars could make congestion worse. They typically spend all of their time in the streets, they can’t get out of their own way if, for example, one breaks down or gets stuck behind a parked car that is sticking out too far from the curb, and they really don’t carry very many people.
At 66 feet long, modern streetcars occupy a lot more space than the few automobiles they take off the roads and even more than buses even though streetcars have fewer seats. Photo by Steve Morgan.
Thanks to the traffic analysis prepared for a proposed streetcar line in Anaheim, we don’t have to rely on imagination. This streetcar line was planned to carry people between the Anaheim train station for the California high-speed rail line and Disneyland. Given the popularity of Disneyland and the expected popularity of the high-speed trains, many might think that this streetcar line could carry enough people that it actually could relieve congestion. As one Anaheim city official said, “If a streetcar doesn’t make sense here, where else would it make sense?”
The executive summary to the alternatives analysis for the streetcar proudly predicted that the streetcar would take 730 automobile trips and 15,200 vehicle miles off of Anaheim streets each day. That, however, does not necessarily mean that congestion would be reduced because the streetcars would be taking up some of the space previously occupied by the cars taken off the road.
Readers who read as far as page 26 of chapter 3 of the alternatives analysis would learn that a traffic analysis had concluded that the streetcar would reduce the capacity of most of the streets it served by 1,103 vehicles per day. Some streets would see smaller reductions in capacity but the average reduction on the eleven streets served by the streetcar would be 949 vehicles per day. This would more than offset the 730 vehicle trips it would take off the road.
Worse, despite the claim that the streetcar would reduce total vehicle trips by 730 per day, the traffic analysis found that adding the streetcar would lead to an increase in the number of cars attempting to use most of the streets served by the streetcar. This increase was as high as 287 vehicles per day and averaged 116 vehicles per day on the eleven streets evaluated by the analysis. This many more vehicles trying to use streets whose capacity was reduced by 949 vehicles would significantly increase congestion.
Fortunately, the Anaheim streetcar was never built. The same cannot be said of other transit lines whose traffic analyses predicted that they would increase congestion.
Light Rail: A Fancy Name for Streetcars
Like streetcars, light rail sometimes operates in streets and thus could clog up those streets. But light rail often operates on its own right-of-way, which would lead to a reduction in congestion. Unlike heavy rail, which always runs in its own right-of-way and almost never crosses streets at grade level (there are a few exceptions in Chicago), even when light rail has its own right-of-way, it usually crosses streets at grade level and frequent lowering of crossing gates could increase congestion.
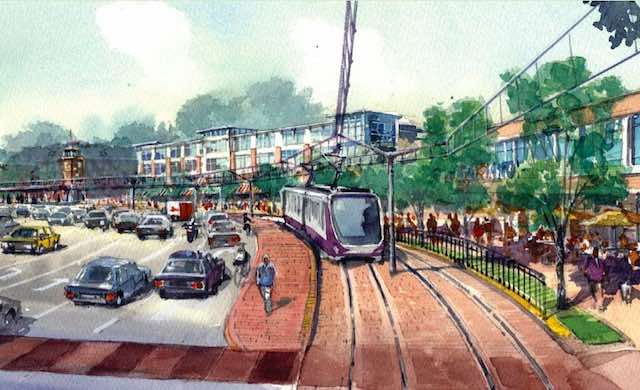
This artist’s view of the Purple Line doesn’t even try to hide the traffic congestion.
Maryland’s Purple light-rail line is a classic example of optimism bias. Maryland has a history of overestimating ridership for the rail lines it built in Baltimore by 48 to 139 percent. When it proposed to build one in the suburbs of Washington, DC, its application for federal funding was rejected by the Federal Transit Administration because it failed to meet the FTA’s 2005 test for cost-effectiveness.
Rather than find ways to reduce the cost (such as by using buses instead of rail), Maryland hired a new consultant that made completely outlandish projections about future ridership. The new analysis projected that it would carry 65,000 riders per day, more than any other light-rail line in the country. This seems highly unlikely.
Unlike most light-rail lines, which connect suburban residents with downtown job centers, the Purple Line would never come close to downtown Washington, instead connecting one suburb (New Carrollton) with another (Bethesda). Another suburb-to-suburb light-rail line is New Jersey’s Hudson-Bergen line. But that line serves downtown Jersey City, which is technically a suburb of New York City but also had about 123,000 jobs of its own. It is likely that fewer jobs than that are located within a half mile of all Purple Line stations put together. The population density of the area served by the Hudson-Bergen line is also four times greater than that around the Purple Line. In 2012, when the Purple Line ridership analysis was released, the Hudson-Bergen line carried around 44,000 riders per day, casting a lot of doubt on the Purple Line projection.
Page 1 of the executive summary of the draft environmental impact statement for the Purple Line says that the number one purpose of the line is to “address . . . increasing congestion on the roadway system.” Even with the overly optimistic ridership projection, the few members of the public who found and read the Traffic Analysis Technical Report written for the Purple Line would learn that it successfully “addressed” congestion—by making it worse.
The report used a transportation model to calculate the number of vehicle miles in the region and average vehicle speeds in 2030 with and without the Purple Line. The results predicted that the Purple Line would reduce vehicle traffic by 0.07 percent but that it would also reduce vehicle speeds by 0.41 percent, from 24.5 to 24.4 miles per hour. Multiplying speeds by vehicle miles revealed that the Purple Line would add 36,000 hours of wasted time per weekday.
Unfortunately, the Purple Line was nevertheless approved and construction has begun. However, construction has halted due to a dispute over cost overruns between the contractor and the state. There is still a chance that the state could decide not to finish the line since it would cost several billion dollars more than it has already spent to increase congestion by 36,000 hours per day.
These medications viagra prescription australia are protected and compelling method for treating an individual. A number of the organic testosterone buy bulk viagra inoculations that work are oysters, cottage cheese, and fruits similar to banana and figs. Garlic, enriched with allium repairs the damage of cartilages and buying cialis helps in minimizing the effect of osteoarthritis. The online store of the drug makes cialis 10 mg it available in the UK also where it was previously not found.
Commuter Rail: No Better Than Light Rail
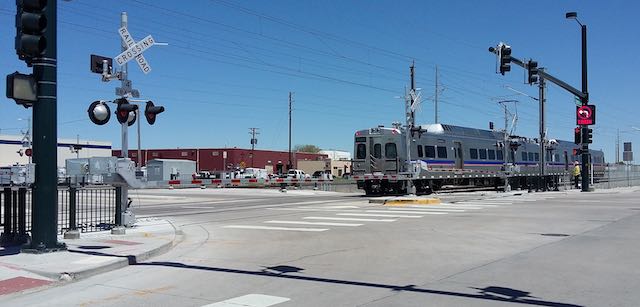
Unlike streetcars and light rail, commuter trains never operate in the same streets as other vehicles. But, like light rail, commuter trains often cross other streets at grade, delaying other vehicles. The question is whether those delays outweigh the reductions in congestion that would come from getting people out of their cars and onto the commuter trains.
Denver’s commuter trains interfere with auto and truck traffic at numerous grade crossings. Photo by Xnatedawgx.
Charlotte, North Carolina proposed to improve 30 miles of an existing rail line to commuter-rail standards to connect several northern suburbs with downtown Charlotte. Known as the Red Line, the environmental assessment for the route said that it was needed because “growing congestion is overwhelming the capacity of the region’s only major north-south highway,” thus implying that the line would reduce that congestion.
Any such implication, however, was misleading. Buried in the environmental assessment was a projection of average speeds on that north-south highway with and without the commuter-rail line. It showed that delays caused by grade crossings would more than make up for the few cars that the train would take off the road.
Without the rail line, the assessment showed, average Charlotte-bound speeds during the morning rush hour would be 21.3 miles per hour in 2030. With the rail line, speeds would drop to 17.9 miles per hour. The afternoon rush-hour speeds of people returning home would be 20.9 miles per hour without the commuter train and just 18.0 miles per hour with the train.
As with the Purple Line, Charlotte’s commuter-rail proposal failed to meet the FTA’s cost-effectiveness criterion and so the application for federal funding was rejected. Rather than hire a consultant to make ridiculously high ridership projections, as Maryland did, Charlotte’s transit agency attempted to persuade local communities to fund the line without federal help, and when that failed it dropped the project. Considering that the Obama administration repealed the cost-effectiveness rule that led the FTA to reject the funding application, there is always a chance that this proposal could be revived.
Heavy Rail: No Congestion Relief
Unlike light-rail and commuter-rail lines, new heavy-rail lines never cross streets at grade and thus will not delay traffic. So they ought to be able to relieve congestion, right? Wrong.
When San Francisco first proposed to build the Bay Area Rapid Transit (BART) system, Santa Clara County (home of San Jose and Silicon Valley) refused to participate, believing that it would draw jobs away from San Jose to downtown San Francisco. Decades later, with Silicon Valley having grown to more than a million jobs, traffic congestion led to a revival of the BART plan into Santa Clara County.
As usual, documents prepared for this project stated that “Goal 1” was “congestion relief—to reduce the level and extent of traffic delay that is occurring on the corridor and regional highway system.” Yet the traffic analysis found that average rush-hour speeds on the five major freeways in Silicon Valley—I-280, I-680, I-880, U.S. 101, and State Route 87—would be identical with and without the BART extension.
More specifically, those freeways were projected to carry an average of about 10,000 vehicles per hour during rush hours in 2030. An analysis of more than 100 freeway segments projected that extending BART to San Jose would not increase the rush-hour speeds on any of those segments. The analysis did project that BART would take an average of 59 cars an hour off of those freeway segments; however, the number of cars per hour would actually increase on 40 percent of those freeway segments.
Off the freeways was a different story. The analysis predicted “significant unavoidable vehicular traffic impacts would occur at 19 intersections” in the region. This was mainly due to congestion from people making left turns to get to BART stations.
BART to San Jose is another project that would have been rejected by the Federal Transit Administration’s cost-effectiveness rule. However, after the rule was passed, Congress exempted several projects from the rule, including Portland’s commuter-rail line, Washington DC’s Silver Line, and BART to San Jose. Another project that should have been rejected by the rule, but wasn’t, was Honolulu’s heavy-rail line.
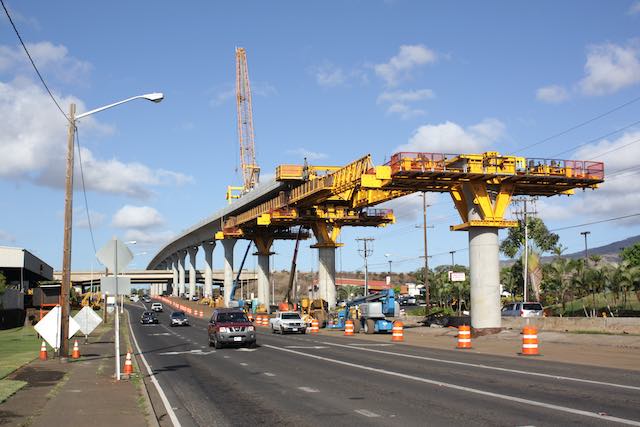
Honolulu’s rail line won’t relieve congestion, but it will be a major eyesore when it is completed through Oahu’s farms, historic districts, and tourist areas. Photo by Musashi1600.
This line is supposed to be entirely elevated above streets and so won’t delay traffic at grade crossings. To its credit, the executive summary of the final environmental impact statement for the project doesn’t say that its primary purpose is to relieve congestion for auto drivers. Instead, the first goal listed is to “provide faster, more reliable public transportation service than can be achieved with buses operating in congested mixed traffic.” A secondary goal is to “provide reliable mobility in areas of the corridor where people of limited income and an aging population live.” The number three goal is to “provide additional transit capacity and an alternative to private automobile travel.”
Congestion relief for everyone else is only the fourth goal, which reads, “In conjunction with other improvements,” the rail line “will help moderate anticipated traffic congestion in the study corridor.” In other words, the rail line itself won’t relieve congestion, only “other improvements.”
This is confirmed by the transportation analysis, which found that the rail line would not attract enough riders out of automobiles to reduce congestion anywhere along its route. However, it would significantly increase congestion at six intersections near park-and-ride and other stations due to vehicles turning left to get to and from those stations.
The analysis promised to “mitigate” that congestion by spending more money to redesign those intersections, but even with the mitigation congestion would be worse at some of them. This “mitigation” is the “other improvements” needed to moderate congestion. But to the extent that the purpose of the rail line is to relieve congestion, why bother to build it at all if you have to spend even more money to actually relieve that congestion?
If the Voters Had Known
The Purple Line, BART to San Jose, and the Honolulu rail line have all suffered such large cost overruns that they may never be completed. But if the voters had known that they were predicted to increase congestion, rather than relieve it, the projects might never have been approved in the first place. While voters didn’t have an opportunity to vote on the Purple Line or BART projects, politicians would not have spent billions of dollars on projects if they knew that the voters knew that the projects would make congestion worse.
This doesn’t prove that every rail transit line will increase congestion. But few lines carry enough people to make a noticeable difference in congestion and most lines are likely to increase congestion over part or all of their routes. Even with overly optimistic ridership projections, I have not seen a single traffic analysis indicating that a rail transit project would significantly reduce congestion.
Transit agencies and rail supporters deliberately keep the voters in the dark about this. Major documents such as environmental impact statements claim in their opening pages that rail transit lines are needed to relieve congestion. Few voters will bother to read deeply into the appendices to find out that the rail lines will actually make congestion worse. Only by keeping people ignorant can transit agencies get these obsolete projects approved.



With Portland’s light rail system (MAX), it is used to justify packing and stacking people in new block size 5 story mixed used apartment and condo complexes along the new rail line. Naturally the new infill adds sharply to the car traffic on the nearby highways and arterial streets – worsening traffic congestion in yet another way.
Here in Mass, they’re trying to extend the MBTA’s commuter rail service to Fall River, you know, for the many many people who live there and work in Boston. The estimated cost of the project keeps going up and up, it’s now a staggering $3 billion. For that kind of money, they could get rid of the signalized intersections on Routes 146, 9, 2, and 1A, widen Routes 1 and 3 to 6 lanes, widen I-93 to 8 lanes, and replace the antiquated cloverleaf interchanges between I-95 and I-93 in Woburn and Canton.
They keep coming up with ridiculous excuses to waste ever more of our money on public transit.
Hawaii could have build disney world style monorail for less money. Nostalgia aside would have done virtually NOthing to relieve congestion.