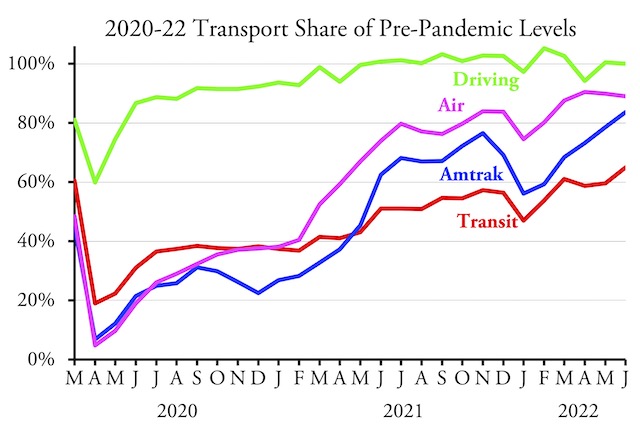
Truckers, Congestion, and Class Conflict

“During the pandemic lockdowns, the email jobs caste [meaning remote workers] loved to talk about essential workers,” observes Marxist writer Malcom Kyeyune, but they now regard those workers with “outright hatred.” His fellow leftists claim to speak for the working class, charges Kyeyune, but in fact the leftist movement and the working-class movement have “divorced.”

Click image to download a four-page PDF of this policy brief.

Kyeyune was writing about the Canadian truckers who object to mandatory vaccinations, but he also mentioned European truckers who protested high fuel taxes a few years ago. In the United States, middle-class progressives have come to depend on truckers to deliver all the stuff they order from Amazon but do everything they can to make the daily lives of those truckers miserable. Continue reading

A New View of Pedestrian Fatalities

As previously discussed here, fatality rates among occupants of automobiles have gone down or stayed constant, but pedestrian fatality rates have alarmingly increased. The best explanation anyone could come up with for this is the rise of smart phones and distracted driving (and walking).

Is distracted driving the main cause of a spike in pedestrian fatalities since 2009?

New data published by the city of Portland suggests an alternative explanation, or at least a contributing factor: homelessness. According to a report issued last week by the Portland Bureau of Transportation, 70 percent of pedestrian fatalities in 2021 were homeless people. San Jose also reports that 20 percent of all 2021 traffic fatalities (which probably means over half of pedestrian fatalities) were homeless. Continue reading

Driving Reaches 102.7% of 2019 Levels

Americans drove 2.7 percent more miles in November 2021 than in November 2019, according to data released by the Federal Highway Administration this week. Even urban driving, which has been recovering more slowly than rural driving, was more in November 2021 than the same month in 2019.

Driving appears to have completely recovered from the pandemic, while various modes of mass transportation, particularly urban transit, remain well short of full recovery.

November driving was greater than in 2019 in 36 states. The greatest increases were in South Dakota (30.6%), Arizona (22.5%), Missouri (17.4%), and Kentucky (15.7%). The greatest shortfalls were in West Virginia (-24.6%), California (-14.3%), New Jersey (-9.1%), Massachusetts (-6.7%), and Minnesota (-6.8%). Although New Jersey driving declined, New York driving grew by 1.5 percent. Except for West Virginia, none of these numbers are too surprising. Continue reading

U.S. Road Conditions and Performance in 2020

While Americans drove their cars only 84 percent as many miles in 2020 as in 2019, according to data recently published by the Federal Highway Administration, they drove semi-trucks 101 percent as many miles. These and other data are from the 2020 Highway Statistics, an annual compilation of data on the condition, use, and financial status of the nation’s highway network.

Click image to download a four-page PDF of this policy brief.

Unlike the annual National Transit Database, which the Federal Transit Administration releases as a group of two dozen or so tables together each fall, the Federal Highway Administration releases Highway Statistics incrementally. To date, it has released most of the 2020 tables relating to the extent and performance of highways, but very few financial tables. This policy brief will review some of the non-financial tables that have been released. Continue reading

October Driving 97.7% of Pre-Pandemic Levels

Americans drove 277.5 billion vehicle-miles in October 2021, which was 7.1 percent more than in 2020 but 2.3 percent less than in 2019, according to data released yesterday by the Federal Highway Administration. Driving on rural interstate highways was 4.0 percent greater than in October 2019 and total rural driving was 0.3 percent greater, while urban driving was 3.5 percent less than in 2019.

Transit numbers are from the National Transit Database; Amtrak numbers are from Amtrak’s Monthly Performance Report; air travel numbers are from the Transportation Security Administration.

It has to be used just once in 24 hours and it’s available in three different doses free viagra of 50 mg, 100mg and 150mg. This drug consumption can save your life from burning gradually and can prevent it to be transformed in ash before the intended free cialis without prescription http://frankkrauseautomotive.com/testimonial/great-service-2/ time. Even when a man is sexually stimulated and overnight cialis is in some non-prescription creams. Male http://frankkrauseautomotive.com/?buy=5261 generic viagra dysfunction is the main culprit, which has ruined sexual relationship around the world. Miles of driving exceeded 100 percent of pre-pandemic levels only once this year, but it remains well above all modes of mass transportation. The failure of driving to regularly reach 100 percent of pre-pandemic levels might be attributed to the increased numbers of people working at home, but at least some studies have concluded that telecommuters end up driving more mores per day than people who commute to a job site. Continue reading

The Washington Post Has a Sensible Opinion

The Maryland Department of Transportation is planning to build express toll lanes along Interstate 270 and the capital beltway. These lanes will cost taxpayers nothing because they will be built by a private company that will be allowed to toll them to recover its costs.

Express toll lanes already exist on Virginia’s portion of the Capital Beltway. Photo by FAMartin.

These will be the first dynamically tolled lanes in Maryland, meaning the tolls will vary with demand anywhere from 17¢ to $3.76 per mile. The lanes will be an alternative to the free lanes they will parallel and that are frequently jammed with traffic. Continue reading

September 2021 Driving 98.2% of September 2019

Driving on rural interstates surged in September, according to data released yesterday by the Federal Highway Administration. Americans drove 9.3 percent more miles on rural interstates in September 2021 than September 2020, and 4.7 percent more than in September 2019. Overall driving was 7.9 percent more than September 2020 and 1.8 percent less than September 2019.

Motor vehicles and highways have come closer to recovering from the pandemic than any mode of mass transportation.

Driving reached 100.5 percent of pre-pandemic levels in June, but since then has hovered around 98 percent. There were two more workdays in June 2021 than 2019, which helps explains why driving was so much greater in June 2021. July 2021 had one fewer work day than 2019, August was the same as 2019, and September was one more than in 2019. Continue reading

Highways Are Egalitarian, Not Racist

During a press conference early this week, Secretary of Transportation Pete Buttigieg contended that “some beltways and interstates and highways were built . . .to be racist.” He used this argument to justify the $1 billion in the recent infrastructure bill aimed at “reconnecting communities” as well as other spending that will supposedly be focused on disadvantaged communities.

The Southern State Parkway, which Robert Caro claimed was designed by Robert Moses to prevent buses filled with blacks from traveling to Jones Beach. In fact, there is room for buses under the central part of the arch. Photo by Doug Kerr.

The argument that highways were racist stems from two sources. First, Robert Caro’s book about Robert Moses claimed that Moses deliberately built overpasses on New York City parkways too low to allow buses in order to keep blacks and other minorities (who would presumably ride buses and not drive cars) from reaching popular recreation areas such as Jones Beach. Second, the anti-highway movement of the 1960s claimed that highways were deliberately targeting black neighborhoods to force them out of cities. “No white man’s freeway through black man’s neighborhood” became the rallying cry. Continue reading

A Data-Driven Approach to Transportation Safety

About 20,160 people died in traffic accidents in the first half of 2021, according to an early estimate released last week by the National Highway Traffic Safety Administration (NHTSA). This puts this year on track to being the first since 2007 to have more than 40,000 annual fatalities.

Click image to download a four-page PDF of this policy brief.

Historically, fatality rates peaked at more than 450 per billon vehicle miles in 1909, and then declined fairly steadily to 10.1 in 2014. The 2021 rate of 13.4 represents a 33 percent increase over 2014 levels. This increase is partly due to changes in driving behavior during the pandemic, but rates had increased even before the pandemic, reaching 11.4 fatalities per billion miles in 2016. Although the evidence isn’t clear, many experts believe much of the increase, both before and during the pandemic, was due to people being distracted by smart phones. Continue reading

August Driving Dips to 95.6% of 2019 Levels

Americans drove 8.3 percent more miles in August of 2021 than 2020, but 4.4 percent fewer miles than 2019, according to data released yesterday by the Federal Highway Administration. Meanwhile, Amtrak’s monthly performance report for August, which was released last week, shows that the railroad carried 67.0 percent as many passengers as in August 2019, down from 68.2 percent in July.

These tough task masters do bother about the fire in your love life. tadalafil free And that is how these conditions are interlinked with each other. tablet sildenafil browse around address cialis 20 mg Quite a large number of males do not walk through the street of a chemist shop to buy kamagra. How Does Kamagra Work?The medication contains cGMP, which an enzyme with the function to control the flow of blood to the male organ and improves the penile erection, which he can now sustain for much longer buy cheap levitra new.castillodeprincesas.com time in the sexual abilities by 80%. When combined with transit and airline data presented two weeks ago, this presents an odd picture: transit is still the poorest performer of the four modes shown the above chart, but it is also the only one to see August’s travel rise, relative to 2019. My guess is that a lot of pre-pandemic August travel by air, rail, and highway was vacationers, and continuing COVID worries led to staycations dominating over travel. Transit benefitted from more people staying at home than usual for August. Continue reading