Search Results for: rail

$117 Billion to Save “Almost an Hour”: Who Cares?

Before the pandemic, two people commuted from Podunk, Michigan to Detroit, a drive of about one hour. If someone built them a high-speed rail line, they could save nearly half an hour, assuming they don’t decide to work at home. Of course, the fares they pay would never come close to covering the $6 billion cost of building the rail line, but who cares about the cost per rider?

“Who cares?” seems to be the attitude of the Northeast Corridor Commission, which consists of Amtrak and the commuter rail agencies that run trains on part of the Boston-to-Washington rail system. Where its 2010 master plan called for spending $52 billion in the corridor, the 2021 plan demands $117 billion to keep running trains in the corridor. But who cares about the increased cost? Continue reading

May Driving Reaches 96% of Pre-Pandemic Levels

Americans drove 95.6 percent as many miles in May 2021 as they did in May 2019, according to data released by the Federal Highway Administration yesterday. This is up from 91.9 percent in April but down from 97.2 percent in March. May’s record is pretty good considering that May had two fewer business days in 2021 than in 2019 while March had two more.

At 99.4 percent of pre-pandemic levels, rural driving is ahead of urban driving, which was just 93.9 percent in May. Drivers in 21 states drove more in rural areas in 2021 than in 2019; urban driving in May 2021 exceeded 2019 in just six states. Continue reading

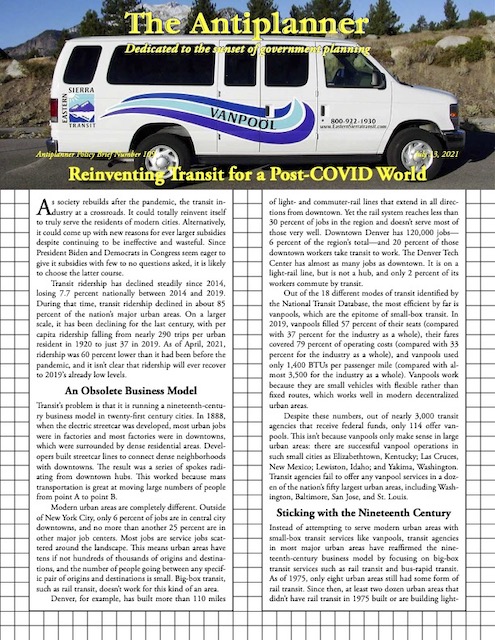
Reinventing Transit for a Post-COVID World

As society rebuilds after the pandemic, the transit industry at a crossroads. It could totally reinvent itself to truly serve the residents of modern cities. Alternatively, it could come up with new reasons for ever larger subsidies despite continuing to be ineffective and wasteful. Since President Biden and Democrats in Congress seem eager to give it subsidies with few to no questions asked, it is likely to choose the latter course.

Click image to download a five-page PDF of this policy brief.

Transit ridership has declined steadily since 2014, losing 7.7 percent nationally between 2014 and 2019. During that time, transit ridership declined in about 85 percent of the nation’s major urban areas. On a larger scale, it has been declining for the last century, with per capita ridership falling from nearly 290 trips per urban resident in 1920 to just 37 in 2019. As of April, 2021, ridership was 60 percent lower than it had been before the pandemic, and it isn’t clear that ridership will ever recover to 2019’s already low levels. Continue reading

Do New Roads Boost the Economy?

“More highway spending won’t rev up the economy,” argues a recent article in the Wall Street Journal. However, the article’s writer, David Harrison, seems a little confused about how highway spending might help the economy.

“The U.S. already has an extensive system of roads, so building more wouldn’t add much to productivity, economists say,” writes Harrison. But this depends entirely on where roads are built. Continue reading

Transit’s Post-COVID Recovery Is Slowest

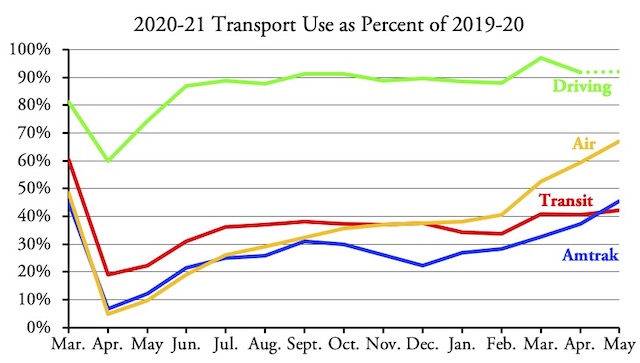
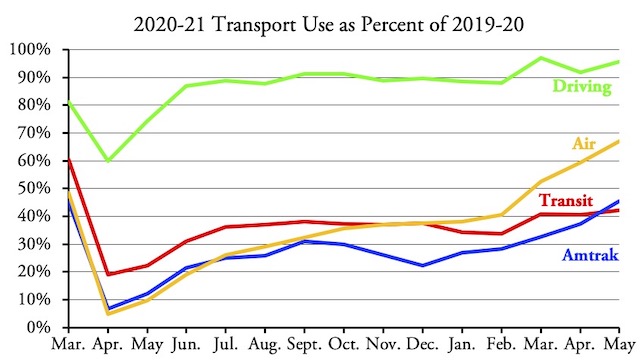
Amtrak’s May ridership surged to 45.2 percent of pre-COVID levels (as compared with May 2019), surpassing public transit, which reached only 42.3 percent of 2019 levels. Transit’s recovery was partly hurt by the fact that May 2021 had two fewer business days than May 2019, but the slow growth makes transit the least-recovered of the various modes of travel.

Shown are transit trips from the National Transit Database, and airline trips from Transportation Safety Administration, and Amtrak passenger miles from the May performance report. Driving is in vehicle miles from the Federal Highway Administration’s Traffic Volume Trends; May highway data won’t be out for another week or so.

As usual, rail transit is doing worse than bus transit when compared with 2019, but rail has also recovered more since 2020. Most of rail’s recovery is in heavy rail and commuter rail; light rail’s recovery is only slightly faster than transit buses and hybrid rail (meaning Diesel-powered light rail) isn’t even recovering as fast as buses. Continue reading

First World, Second World, Third World

Someone should teach The Hill‘s headline writers a little history. A recent article about why we should give more subsidies to Amtrak and high-speed rail was headed, “The US is a first-world nation with a third-world rail system.”

Actually, the United States is a first-world nation with a first-world rail system which is probably the best rail system in the world. The only other contender for the title would be Canada.

Few people seem to remember that “first-world” terminology grew out of the Cold War. At that time, the First World consisted of capitalist countries such as the United States and Canada while the Second World was socialist countries such as the Soviet Union and China. The Third World included developing countries that hadn’t really decided whether they were going to follow the capitalist or socialist model (with those that failed to choose capitalism remaining poor today). Continue reading

2021 Urban Mobility Report

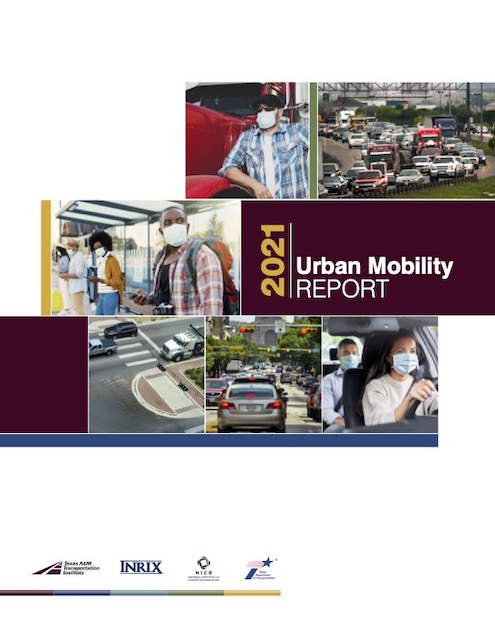
In what may be one of the most obvious reports ever, the Texas Transportation Institute has announced that congestion in 2020 was only about half as bad as congestion had been in 2019. The institute used to publish its congestion reports each year, but the 2021 Urban Mobility Report is the first in several years. The last report had data only through 2017, but this one goes through 2020.

Click image to download a copy of this report.

The report estimates that congestion cost commuters $190 billion in 2019, declining to $101 billion in 2020. Congestion also cost shippers $172 billion in 2019, falling to $95 billion in 2020. While these are interesting, if somewhat incomprehensible, numbers, the report doesn’t provide a lot of guidance about what to expect in the future. Continue reading

How San Jose Held Up Google for $200 Million

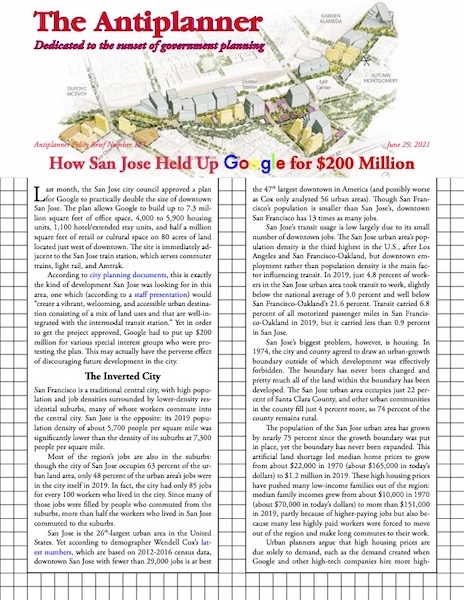
Last month, the San Jose city council approved a plan for Google to practically double the size of downtown San Jose. The plan allows Google to build up to 7.3 million square feet of office space, 4,000 to 5,900 housing units, 1,100 hotel/extended stay units, and half a million square feet of retail or cultural space on 80 acres of land located just west of downtown. The site is immediately adjacent to the San Jose train station, which serves commuter trains, light rail, and Amtrak.

Click image to download a four-page PDF of this policy brief.

According to city planning documents, this is exactly the kind of development San Jose was looking for in this area, one which (according to a staff presentation) would “create a vibrant, welcoming, and accessible urban destination consisting of a mix of land uses and that are well-integrated with the intermodal transit station.” Yet in order to get the project approved, Google had to put up $200 million for various special interest groups who were protesting the plan. This may actually have the perverse effect of discouraging future development in the city. Continue reading

Infrastructure Arithmetic

The White House and Senate Republicans have compromised on a $1.2 trillion infrastructure bill. Meanwhile, President Biden and Republican leaders have agreed to a $579 billion infrastructure bill.

Since $579 billion is less than half of $1.2 trillion, both of these statements can’t be true — and yet they are. The difference is that the $1.2 trillion includes “baseline spending,” or the amount that would have been spent on infrastructure even if no bill were passed. The actual infrastructure bill would only include $579 billion of new spending. That’s quite a concession on the part of the White House, which had originally proposed $2.3 trillion in new spending, or nearly four times as much as the bipartisan agreement. On the other hand, $579 billion is exactly $579 billion more than Republicans had proposed to spend before Biden released his original proposal on March 31.

At the same time, the so-called baseline appears to represent the amount that would be spent on surface transportation by the bill proposed by House Democrats, or about $78 billion a year. This is a large increase from the amount that has been spent in the past few years, which has been about $55 billion a year. In order to get the total above $1 trillion, allowing the president to save some face, the $78 billion a year is extended for eight years, even though the House bill would authorize only five years of spending. Continue reading

Japan Maglev Controversy

Plans to build a maglev line between Tokyo and Nagoya may be threatened by local opposition. The proposed route would go through the Shizuoka prefecture, where people fear that a long South Alps Tunnel required for the train will affect their water supplies.

This famous scene of the Shinkansen in front of Mount Fuji is in Shizuoka prefecture. Photo by MaedaAkihiko.

Leading the opposition is Shizuoka Governor Heita Kawakatsu, who won re-election this week in a campaign where the rail line was a major issue. Kawakatsu represents a minority party while his opponent was endorsed by the Liberal Democratic party, which has been the majority party in Japan for many years. Continue reading