Search Results for: rail

NYC Transit Is Not Vital to the Nation

According to “experts,” saving New York City’s transit is “vital to the U.S. economy,” reports an article in Business Insider. These “experts” include the usual gang of transit advocates, including the chair of New York City’s Metropolitan Transportation Authority (MTA), an urban planning professor at New York University, and the Manhattan Institute’s Nicole Gelinas, all of whom fervently believe that New York financial workers are, if not the masters of the universe, still critical to making the earth successfully rotate around the sun.

New York is “the only place where you have an abundance of face-to-face contact,” says Gelinas, which is supposedly is why its economic productivity was so high. Because Manhattan is so compact, “you can have many, many meetings every day with your potential vendors, your customers, your competitors,” something that supposedly isn’t possible in the suburbs.

I skeptical that maximizing the number of boring meetings per day somehow makes people more productive. Besides, what good are face-to-face meetings when everyone is wearing a mask? If they need to, people can have more meetings per day over Zoom, Skype, or FaceTime without masks and without having to travel from one meeting to the next. Continue reading

Giving Transit a Pass

Everyone knows that transit is so morally superior to driving that we aren’t supposed to ask about how much it costs. Pay no attention to the fact that the next light-rail line Portland wants to build will cost nearly $3 billion; planners don’t mention the cost in their presentation of the proposal.

Nor are we supposed to ask whether anyone is actually riding transit. When Portland’s last light-rail line, which cost $1.5 billion, opened a few years ago, transit ridership declined. But that’s no reason to question the next line.

Now we have some new questions are we aren’t supposed to ask. A bill signed by California Governor Gavin Newsom on Monday has exempted transit projects from detailed environmental review, meaning we no longer get to find out that the rail project that’s supposed to reduce greenhouse gas emissions will actually increase them. Not surprisingly, the bill was written by state Senator Scott Wiener, who also wants to force single-family neighborhoods to accept high-density transit-oriented developments in their midst. Continue reading

The Last Pre-Pandemic Snapshot of the USA

The United States had 2.3 million more workers in 2019 than in 2018, and more than 30 percent of the increase worked at home. This boosted the share of people who worked at home from 5.3 to 5.7 percent.

Click image to download a five-page PDF of this policy brief.

Historian Stephen Davies observes that a major pandemic does not “introduce something novel.” Instead, “it accelerates and magnifies trends and processes that were already under way.” It can also bring “a final stop to processes that were already exhausted.” People working at home is an example of a trend that is being accelerated and magnified by the COVID-19 pandemic. Continue reading

DC Metro Should Just Shut Down

With transit ridership off by 84 percent in July, what better time than now to simply stop running the expensive and failed DC Metro rail system? Apparently hardly anyone really depends on it, as driving was back to at least 80 percent of its pre-pandemic levels in July.

Based on a budget update provided to the Metro board, the Washington Metropolitan Area Transportation Authority (WMATA) may have to shut down, as it expects to run out of money around next January. WMATA says it needs at least $212 million to operate through June, 2021 (the end of its fiscal year), plus more, of course, for the following year.

To deal with this, WMATA is proposing to reduce rail and bus frequencies, cut back late-night service, cancel 39 bus routes, and defer some capital improvement projects to a later date. But even these cuts won’t completely close the gap between shrinking revenues and costs. Moreover, due to the need for public hearings and other requirements, WMATA won’t even be able to implement any changes until December, so it will continue to hemorrhage money for few riders for several more months. Continue reading

Transit and the Mania for Density

When I was in high school—this would be about 1969—my social studies teacher asked the class to imagine we could design the city of Portland from scratch. What would it look like? I did a few calculations and realized that, if people were packed into higher densities, most of the city could be left as parks and open space. My vision called for a grid of high-rise clusters with a mixture of retail shops and apartments, accompanied by some single-family homes. Each cluster would be surrounded by forests and parks and connected with the others by rail transit so no one would have to drive. Industrial areas would be located in their own clusters.

Click image to download a four-page PDF of this policy brief.

It never occurred to me to ask whether people wanted to live in high rises, whether the cost of building housing in high rises would be more than the cost of single-family homes, or whether people would still need cars because they might want to go somewhere not reachable by train. In essence, I had designed the Ideal Communist City as described in a book by that name that was first published in English in 1971. That book was influenced by Swiss architect Le Corbusier’s Radiant City, which he proposed in the 1930s. Planning historian Peter Hall called Corbusier “the Rasputin of urban planning” for his authoritarian views and the ways in which he beguiled and misled generations of urban planners. Continue reading

Wildfire Update

Wildfires continue to burn out of control in much of Oregon, California, and Washington, though they aren’t expanding as fast as they did during last Monday’s wind storm. Most of the Northwest is under a blanket of smoke that is hazardous to our health; the good news is the smoke is cooling temperatures by 10 degrees or so, thus reducing the rate of spread of the fires.

About 1.5 percent of Oregon has burned in the last week with an unusual number of fires burning nearly to the borders of cities such as Ashland, Medford, Oregon City, Roseburg, Salem, and Springfield. Click image for a larger view. Map from Firemappers.

Yesterday’s national situation report was the first I have seen this year in which the number of acres burned exceeded the ten-year average through this date. I downloaded the previous ten years of September 13 reports and found that the Pacific Coast states, central Rockies, and Southwest have all seen more acres burn than the ten-year average, but Alaska, the Northern Rockies, Great Basin, East, and South are well below average. Continue reading

Rapid Bus: Finding the Right Model

In 2005, Kansas City opened its Main Street bus-rapid transit line, one of the first of its kind in the nation. The buses were “branded’ with distinctive paint jobs and, like light rail, stopped less frequently than regular buses, increasing their average speeds. They also ran four times per hour instead of the twice-per-hour schedules of many local buses.

Click image to download a six-page PDF of this policy brief.

Sharing lanes with other traffic, the buses didn’t have a dedicated right of way, didn’t require people to pay before they board, didn’t have priority at traffic signals, and didn’t use other advanced technologies. Despite this, the increased frequencies and speeds generated a 50 percent increase in ridership on the route. Continue reading

July Transit Ridership Down Almost 65 Percent

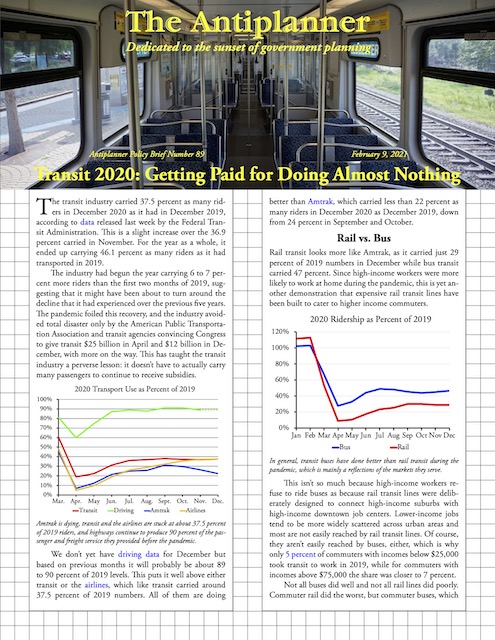
Transit ridership in July 2020 was 64.9 percent less than it had been in July 2019, according to data released last Friday by the Federal Transit Administration. This is only a slight improvement from June, when ridership was down by 69 percent from June 2019. July bus ridership was down by 52 percent (vs. 56% in June) while rail ridership was down by 77 percent (vs. 83% in June).

Worst off was Washington DC, whose July ridership was still down by 82 percent, about the same as in June. At the other extreme was Richmond, Virginia, where July ridership was down by only 21 percent. Many urban areas in Florida and Texas were down by less than 50 percent. Apparently, the South has risen again, or at least transit ridership in the South has risen faster than in the north.

As usual, I’ve uploaded an enhanced version of the FTA’s spreadsheet, which has month-by-month data for each transit agency and mode. My enhanced version has annual totals in columns HY to IQ, mode totals in rows 2190 through 2211, agency totals in rows 2220 through 3219, and urban area totals for the nation’s 200 largest urban areas in rows 3220 through 3424. These enhancements are made on both the ridership (UPT for unlinked passenger trips) and service (VRM for vehicle revenue miles) pages. Continue reading

Table 1-40 Redux

Last July 14, I devoted an entire Antiplanner policy brief to a review of a single table in the Bureau of Transportation Statistics’ publication, National Transportation Statistics, table 1-40, passenger-miles by mode. My main concerns were that the table overestimated bus miles and failed to include walking and cycling miles.

Just four weeks later, on August 11, the Bureau of Transportation Statistics issued an update to table 1-40. The update reduces the number of bus passenger-miles (though not by as much as I estimated) and added walking and cycling miles.

Walking and cycling numbers are based on the National Household Travel Survey, which is repeated every five to eight years. As a result, table 1-40 only includes numbers for the years of that survey. Fortunately, the most recent survey was in 2017, so the numbers should be pretty comparable with the latest numbers for other modes, which are for 2018. Continue reading

The Streetcar Intelligence Test

The first electric streetcars and the first internal-combustion engine automobiles were first developed just over 130 years ago. Initially, each went about 8 to 10 miles per hour. Today, people routinely drive automobiles at 70 to 80 miles per hour, and some supercars can go well over 200 miles per hour. Meanwhile, according to the American Public Transportation Association, the average speed of streetcars is a whopping 6.9 miles per hour.

Click image to download a five-page PDF of this policy brief.

Streetcars were rendered obsolete in 1927 with the introduction of the Twin Coach bus, the first bus that was both cheaper to buy and cheaper to operate than streetcars. Within a decade, half of America’s streetcar systems had converted to buses. The infamous General Motors streetcar conspiracy, which began in 1937, was actually a conspiracy to take business away from Twin Coach buses, not to destroy streetcars which were already rapidly disappearing. By 1974, only six cities still had streetcars, usually because they went through tunnels or used a dedicated right of way not open to buses. Continue reading