
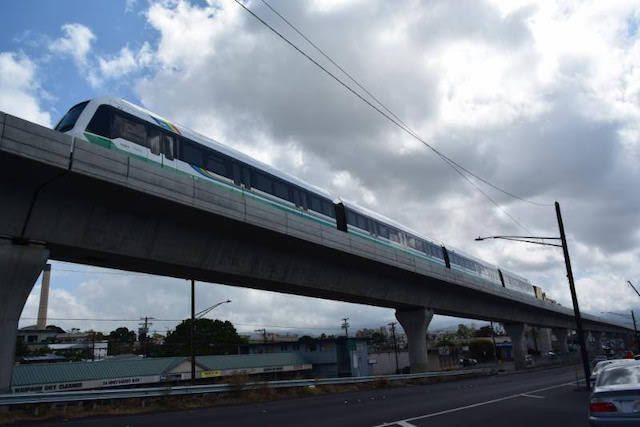
Public transit carried 6.4 percent of 2021 motorized passenger travel in the New York urban area. It also carried 1.6 percent in Honolulu, 1.5 percent in San Francisco-Oakland, 1.4 percent in Seattle, 1.2 percent in Chicago, and 1.1 percent in Salt Lake City. In every other urban area it carried less than 1 percent; nationwide, transit carried just 0.7 percent of all motorized urban travel.
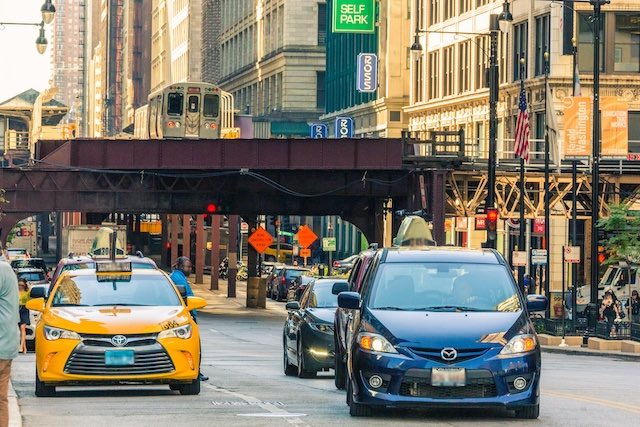
Chicago transit carried 1.2 percent, autos the other 98.8 percent of motorized passenger travel.
I calculated these numbers by comparing passenger-miles in the 2021 National Transit Database, which was released last fall, with daily vehicle miles of travel (DVMT) by urban area in table HM-72 of Highway Statistics, which was recently released by the Federal Highway Administration. To make the numbers comparable, I multiplied DVMT by 365 to get annual data and by 1.7 to account for vehicle occupancies, 1.7 being the result when dividing passenger-miles by vehicle-miles in Highway Statistics table VM-1. These numbers don’t include walking, bikes and e-bikes, or scooters, but they do include motorcycles. Continue reading


