Democrats on the House Transportation and Infrastructure Committee are proposing to increase transportation spending from $305 billion over the last five years to $547 billion over the next five years. Although this is supposed to be a five-year bill, it will really be a six-year bill spending at least $656 billion, as Congress is never able to pass a major bill during an election year and will simply extend it a sixth year at the then-current rate of spending.
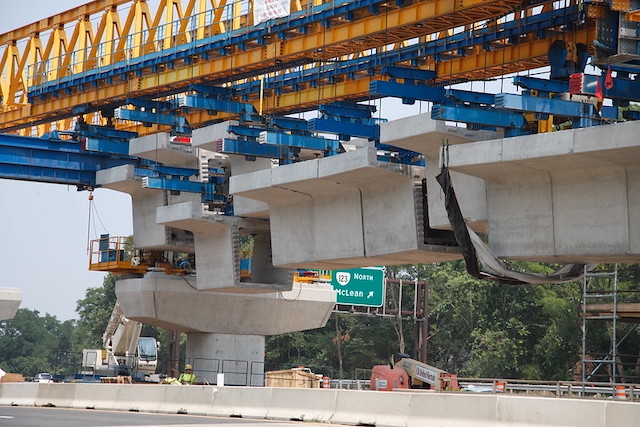
Many megaprojects, such as Boston’s Big Dig and Dulles MetroRail (shown here) are built not because they are needed but because politicians can get the federal government to pay for them with “free” money. The proposed transportation bill will encourage more such megaprojects. Photo by Tom Saunders, Virginia Department of Transportation.
The proposed bill would increase spending on highways by 54 percent, double spending on transit, and triple spending on Amtrak. Although transit and Amtrak together carried 1.0 percent of passenger miles before the pandemic and less than 0.6 percent of passenger miles in the last year, the bill would give them 37 percent of the federal funds. Moreover, while federal funding of roads would be hampered by a “fix-it-first” rule, federal spending on transit would have no such limit even though transit infrastructure is in much worse shape than highway infrastructure. Continue reading