
Now that Congress has passed an infrastructure bill, major media outlets are beginning to ask questions about how the money will be spent. Using the Honolulu rail project as an example, the New York Times wants to know why so many infrastructure projects suffer from such large cost overruns. Bloomberg asks similar questions using Boston’s Green Line extension as an example.
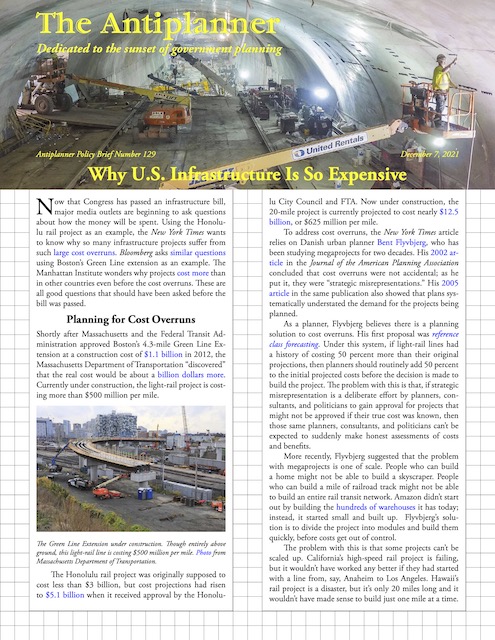 Click image to download a four-page PDF of this policy brief.
The Eno Transportation Foundation and Manhattan Institute wonder why projects cost more than in other countries even before the cost overruns. These are all good questions that should have been asked before the bill was passed.
Planning for Cost Overruns
Shortly after Massachusetts and the Federal Transit Administration approved Boston’s 4.3-mile Green Line Extension at a construction cost of $1.1 billion in 2012, the Massachusetts Department of Transportation “discovered” that the real cost would be about a billion dollars more. Currently under construction, the light-rail project is costing more than $500 million per mile.
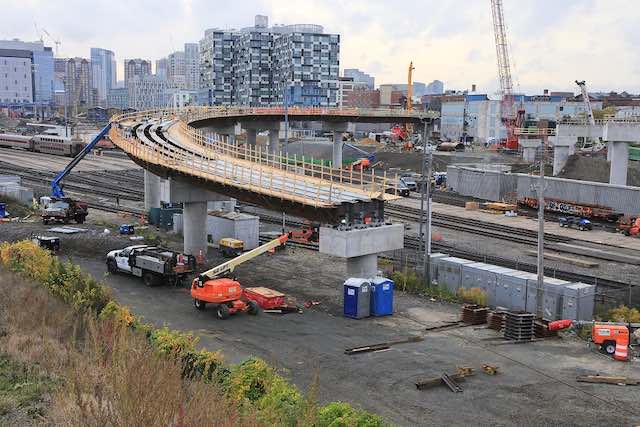
The Green Line Extension under construction. Though entirely above ground, this light-rail line is costing $500 million per mile. Photo from Massachusetts Department of Transportation.
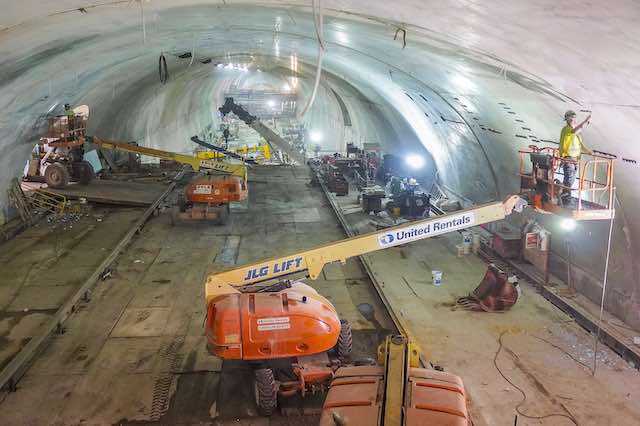
The Honolulu rail project was originally supposed to cost less than $3 billion, but cost projections had risen to $5.1 billionwhen it received approval by the Honolulu City Council and FTA. Now under construction, the 20-mile project is currently projected to cost nearly $12.5 billion, or $625 million per mile.
To address cost overruns, the New York Times article relies on Danish urban planner Bent Flyvbjerg, who has been studying megaprojects for two decades. His 2002 article in the Journal of the American Planning Association concluded that cost overruns were not accidental; as he put it, they were “strategic misrepresentations.” His 2005 article in the same publication also showed that plans systematically understated the demand for the projects being planned.
As a planner, Flyvbjerg believes there is a planning solution to cost overruns. His first proposal was reference class forecasting. Under this system, if light-rail lines had a history of costing 50 percent more than their original projections, then planners should routinely add 50 percent to the initial projected costs before the decision is made to build the project. The problem with this is that, if strategic misrepresentation is a deliberate effort by planners, consultants, and politicians to gain approval for projects that might not be approved if their true cost was known, then those same planners, consultants, and politicians can’t be expected to suddenly make honest assessments of costs and benefits.
More recently, Flyvbjerg suggested that the problem with megaprojects is one of scale. People who can build a home might not be able to build a skyscraper. People who can build a mile of railroad track might not be able to build an entire rail transit network. Amazon didn’t start out by building the hundreds of warehouses it has today; instead, it started small and built up. Flyvbjerg’s solution is to divide the project into modules and build them quickly, before costs get out of control.
The problem with this is that some projects can’t be scaled up. California’s high-speed rail project is failing, but it wouldn’t have worked any better if they had started with a line from, say, Anaheim to Los Angeles. Hawaii’s rail project is a disaster, but it’s only 20 miles long and it wouldn’t have made sense to build just one mile at a time.
Gold-Plated Transit Projects
The reality is that there isn’t a planning solution to cost overruns and other strategic misrepresentations as these aren’t planning problems; they are political issues that reflect the political process of getting projects approved. “In the world of civic projects, the first budget is really just a down payment,” opined former San Francisco mayor Willie Brown in 2013. “If people knew the real cost from the start, nothing would ever be approved. The idea is to get going. Start digging a hole and make it so big, there’s no alternative to coming up with the money to fill it in.” Brown wrote these words with approval, but they should be appalling to anyone who cares about efficiency or responsibility to taxpayers.
In any case, overruns are really just a symptom of the real problem. As the Manhattan Institute’s Connor Harris argues, the New York Times’ focus on cost overruns fails to see the big picture, which is that–even before overruns–costs in the United States are much greater than in other countries.
The Second Avenue Subway, the most-expensive subway line in the world, under construction in 2013. Photo by the Metropolitan Transportation Authority.
For example, New York City’s Second Avenue Subway was projected to cost $3.8 billion but actually cost $4.5 billion. But, Harris points out, even at $3.8 billion, “it would still have been twice as expensive as any subway project in the world.” Unfortunately, Harris doesn’t seem to have any idea why projects cost more in the United States than elsewhere. He claims at least some of the high costs are due to the planning process, which in the United States relies on public involvement.
“New rail projects in the United States must run through endless community meetings where residents–often rich retirees who do not commute by public transit and have no work or childcare obligations that would keep them away from hours-long meetings–can demand additional spending to address local aesthetic concerns,” argues Harris.
He blames the high cost and cost overruns of Boston’s Green Line extension on community demands that a 2-mile-long bike path be added to the project, but the study he cites shows that this was only a small portion of the cost overrun. Harris blames the high cost of the California high-speed rail project on pressure from “local interests” to serve Fresno and other Central Valley cities when “the natural direct route” would have been to follow Interstate 5 (which misses almost all population centers between Los Angeles and San Francisco). But the selected route added only 21 miles or less than 5 percent to the length of the system, which was hardly responsible for the tripling to quadrupling of costs since the initial estimates.
Like the United States, China’s megaprojects have suffered from cost overruns and benefit shortfalls, yet no one can accuse China of having too much public involvement in its decisionmaking. Where Harris, the New York Times, and Bloomberg focus only on recent projects, to understand the real problems it is helpful to compare past projects with recent ones.
A Tale of Two Light-Rail Lines
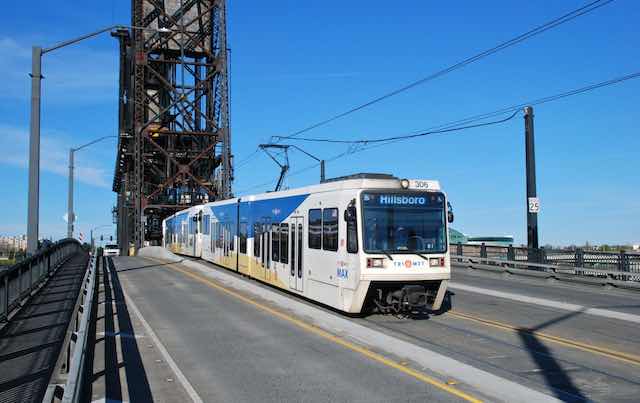
Portland opened its first light-rail line in September 1986. It opened its newest light-rail line 29 years later in September 2015. Both lines followed an existing railroad right-of-way that paralleled a major highway for much of their distance. Yet the costs of the two projects were far different.
The 1986 project, known as the Blue Line, cost $214 million for 15.1 miles, or $14.2 million per mile. That’s about $30.4 million per mile in today’s dollars. (Since 1986, the Blue Line was extended to be twice as long, but in this paper the term Blue Line refers only to the original line.) The 2015 project, known as the Orange Line, cost $1.49 billion for 7.3 miles, or $204 million per mile, which is $233 million per mile in today’s dollars. What made the recent line cost nearly eight times as much, per mile, as the original line?
The Blue Line sensibly crossed the Willamette River over an existing bridge. Photo by Steve Morgan.
One answer is that the Blue Line crossed the Willamette River over an existing bridge, while the Orange Line built a brand-new bridge, open only to light rail and pedestrians/cyclists. The new bridge cost $135 million, less than 10 percent of the total cost of the light-rail line, but it is symptomatic of the problem, as the idea of building a bridge just for light rail would have been unthinkable in 1986.
Both lines had cost overruns. Although Wikipedia claims that the Blue Line “was completed $10 million under budget,” it is comparing the projected cost of the light-rail line plus reconstruction of an adjacent highway with the final cost of the light-rail line alone. According to a 1990 report published by the Department of Transportation, the Blue Line was originally projected to cost $172 million and its actual final cost was $266 million, meaning it had a 55 percent cost overrun. The earliest cost projection for the Orange Line was $1.215 billion, so it had a 23 percent overrun.
Nor did either line do much for transit ridership. In 1985, the year before the Blue Line opened, Portland transit carried 58.0 million trips. In 1987, the year after the line opened, it carried 53.5 million trips. In the year before the Orange Line opened, Portland transit carried 114.4 million trips; in the first full year after it opened, it carried 112.5 million trips.
But the real question is why costs increased. Even with its larger cost overrun, the Blue Line’s cost was far less than that of the Orange Line. One answer is that the sources of money were completely different.
The Blue Line was built under a 1973 law allowing cities to cancel planned interstate freeways and spend the federal share of freeway funds on transit capital improvements instead. Portland cancelled a freeway whose federal share was expected to be $173 million, which is why the original light-rail cost projection was approximately that amount. While there was a cost overrun, that overrun had to be paid out of local funds so the region had an incentive to keep costs down.
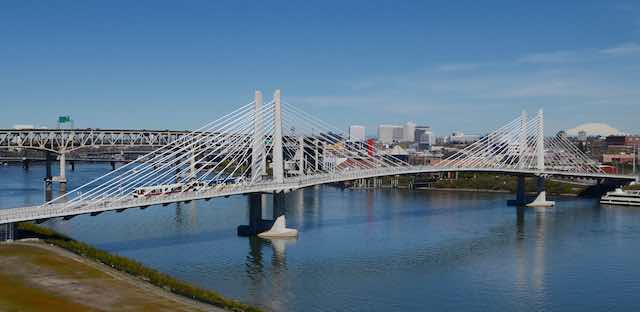
A new bridge added $135 million to the cost of the Orange Line, but this was only about 10 percent of the difference in costs between it and the original Blue Line. Photo by Steve Morgan.
The Orange Line was built under a 1991 law (and its successors) that created a federal pot of money for making transit capital improvements. Although the original law required transit agencies to show that the projects they wanted to build were “cost effective,” the Federal Transit Administration made it clear that it would do very little to enforce this requirement, which it virtually eliminated in 2013. The amount of money a transit agency received from this fund was proportional more to the costs of the projects they were proposing than to any sense of benefits or cost effectiveness.
Other light-rail lines built in the 1980s, usually with freeway turn-back funds, had similarly low costs. An 18-mile line in Sacramento cost (in today’s dollars) $20 million per mile. A 10.5-mile line in Pittsburgh cost $114 million per mile, partly because it included a downtown subway. The most expensive was the Buffalo light rail, 80 percent of which was built underground, leading to a cost of $212 million per mile.
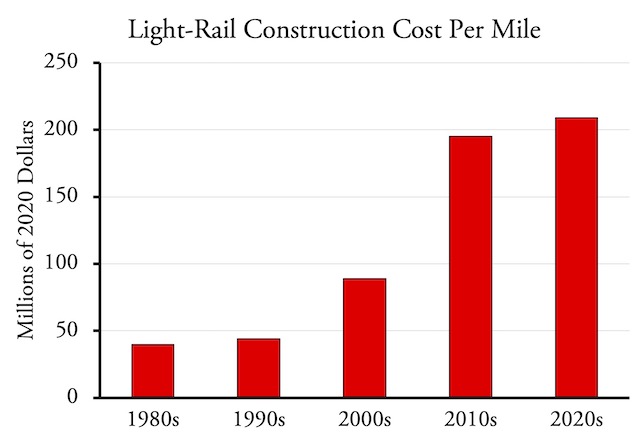
Costs of light-rail construction have rapidly increased since the 1990s. The 2020s cost isn’t much more than the 2010s, but the decade isn’t over yet. Source: FTA data.
Rail costs today are much higher. Based on projects evaluated by the Federal Transit Administration’s projected-and-actual cost studies, in the 1980s, light-rail projects excluding Buffalo’s subway cost an average of $40 million per mile in today’s dollars. In the 1990s, this increased slightly to $44 million, but in the 2000s, costs per mile doubled to $89 million. Costs of projects completed since 2010 have more than doubled again, rising to $195 million per mile.
In 2016, Seattle opened a 3.1-mile light-rail line that was entirely underground. In today’s dollars, it cost $1.77 billion, or $571 million per mile–close to three times the cost of Buffalo’s line. Light-rail projects currently funded or being considered for funding by the Federal Transit Administration are expected to cost an average of $209 million per mile, or three to four times the average inflation-adjusted cost of light-rail lines in the 1980s. None cost less than $113 million per mile, more than three times the cost of Portland’s Blue Line and five times the cost of Sacramento’s first light-rail line. Nearly all of these are above ground yet cost as much as Buffalo’s line in 1987, which was mostly underground.
Highway construction costs have also grown, but at a much slower rate than transit costs. Highway construction costs have nearly doubled in the last two decades, but after adjusting for inflation, they’ve grown by only about 40 percent. By comparison, transit costs more than doubled after adjusting for inflation.
According to a 2019 report from the Department of Transportation, constructing freeways in major urban areas cost an average of $15.4 million per lane-mile in 2014, which is about $17.0 million in today’s dollars (see p. A-4). Most light-rail lines have dual tracks, making one light-rail route-mile the physical equivalent of two lane-miles. Based on this, light-rail costs in the 1980s appear reasonable. Present-day costs do not. (Of course, the transportation benefits of light rail are far smaller than for urban freeways, so if the two cost the same then freeways still have better benefit-cost ratios.)
In short, media reports that the United States has high construction costs compared with other countries should, in all fairness, also note that those costs are high compared with a few decades ago. This means the question is not, “Why are U.S. transportation construction costs higher than the rest of the world?” but instead, “Why are today’s transit construction costs higher than costs 30 years ago?”
So Why Are Costs So High?
In 1982, Congress first allocated a share of federal gas taxes to transit. This gave transit a dedicated source of funds that was completely detached from whether transit actually performed any transportation services.
Then, as previous mentioned, in 1991 Congress created a multi-billion-dollar slush fund for building new transit projects and the FTA’s failure to impose any cost-effectiveness controls. This effectively gave transit agencies incentives to gold-plate their plans in order to be eligible for the most federal funding.
On top of this, the 1998 reauthorization of the 1991 broke from historic precedent of limiting most highway and transit spending to the revenues earned from gas taxes and other federal highway user fees. Previously, Congress would estimate future highway revenues and authorize spending equal to those projections, but if revenues fell short of projections, then actual spending would be less.
The 1998 law contained thousands of earmarks. To ensure that all earmarks were fully funded, Congress mandated that spending take place at allocated levels even if revenues didn’t match expectations. This first happened in 2008, when Congress had to appropriate $8 billion to keep the Highway Trust Fund solvent (see “Net Transfers”). Another $7 billion was added in 2009, nearly $20 billion in 2010, and a total of $30 billion more in 2012, 2013, and 2014. In the 2015 reauthorization of the law, Congress simply appropriated $70.1 billion to cover excessive spending over the following five years.
This more-or-less took the gloves off of deficit spending. Now, no one in Congress, the Federal Transit Administration, the transit industry, or metropolitan transportation planning agencies worried about the cost-effectiveness of spending because Congress could simply appropriate more money to spend. This was less true in state highway agencies, most of which were still spending only the amount of federal and state user fees that Congress and the states had dedicated to their use.
These two laws explain the mechanisms that allowed transit spending to wildly grow in the past three decades. But they don’t really explain how we got to the point that such laws made sense.
In 1982, economist Mancur Olson suggested that societies that enjoy long periods of stability will “accumulate more collusionsand organizations for collective action over time.” Olson called these groups “distributional coalitions” because their goal was not economic growth but redistribution of existing economic productivity. Such coalitions, he said, “slow down a society’s capacity to adopt new technologies and to reallocate resources in response to changing conditions, and thereby reduce the rate of economic growth.”
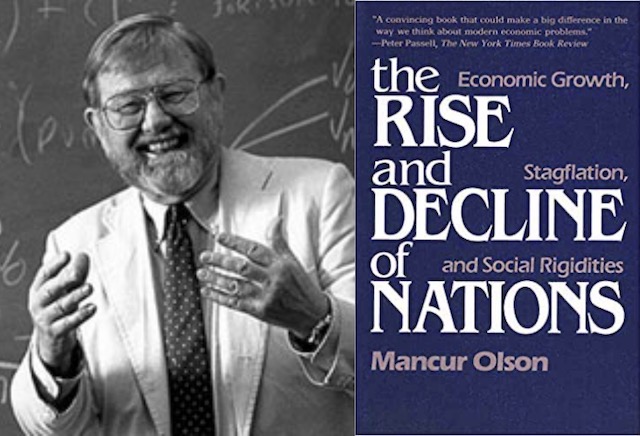
Olson and his 1982 book.
This perfectly describes what has happened to U.S. transportation policy in recent decades. The transit lobby, consisting of rail contractors, transit unions, environmental groups, and the transit agencies themselves, issued a steady drumbeat of propaganda that became conventional wisdom simply because so few challenged it.
Transit advocates are totally upfront about this, opposing new roads because they increase mobility–which highway opponents call induced demand but I call increased economic productivity. Instead, they support transit as a way of “getting people out of their cars,” in other words, out of low-cost transportation and onto high-cost transportation, which reduces economic productivity.
All transportation is subsidized, they say, so people shouldn’t calculate the subsidies to transit or ask why transit subsidies need to be a hundred times greater, per passenger mile, than highway subsidies. The latest rallying cry is that transit should be measured by “social equity” goals rather than transportation goals; nevermind that transit taxes are terribly inequitable. In reality, the main goal of the transit lobby is to redistribute monies earned by people who drive cars to transit programs, even if those programs do nothing to improve transportation.
Many economists believed that Olson deserved a Nobel Prize for his work, but unfortunately before he was awarded one he died at the relatively young age of 66. He also died before finding a way to counter the destructive activities of distributional coalitions, suggesting only that it had something to do with protecting property rights and adopting sensible economic policies. Ultimately, his research seemed to show that the power of distributional coalitions is only ended through major calamities such as losing a war.
We have to hope that it doesn’t come to that. It is clear we need to turn away from transportation policies based on slogans and absurd claims that it is somehow better to spend money on transportation modes that most Americans never use instead of on modes that we use every day.


Highway and road construction and maintenance should be paid by a mileage tax — now possible using GPS technology. Those claiming that this is an unconstitutional invasion of privacy should read about E-ZPass.
https://en.wikipedia.org/wiki/Electronic_toll_collection#Privacy
Financing through the public sale of bonds to be paid from tolls (with no recourse to public money) would eventually root out overly optimistic construction cost forecasts.
Do any of these outlets mention the fact that the federal government showers these projects with enormous amounts of funding and essentially provides a blank check to cover cost overruns as a proximal cause of the high costs of megaprojects?
Every consumer industry the government touches raises prices. What incentive do they have to corral prices if govt covers overhead. Worse they speculate prices based on what they can get away with. And when they’re asked to explain why a billion dollar project costs 2 billion. No genuine answer….
Beyond that the govt to labor industrial complex is very union based and politically corrupt. They view for contracts and fight tooth and nail against competition. Politicians win whole elections on WHO builds WHAT.
Every industry government subsidizes raises prices. When government got involved in college loans in the 60s onward…..price of university average has tripled since then. My friends uncle went university in engineering, graduated 1971, his degree cost just shy of 10000 dollars. 60,000 plus….in today’s money.
Union work rules, political incentives to pass away money. Infrastructure built for no other reason than to appease political constituents regardless of usefulness…..MOST OF ALL Government doesn’t audit or accredit costs of labor and materials and doesn’t penalize cost overruns. If I want a deck built, I shop around…..
Government doesn’t, they build infrastructure based on decades long plans of perceived studies. Planning in advance is supposed to be economical but it still doesn’t cover cost overruns. By contrast Sandy Springs, Georgia outsourced its service functions to a private contractor who hire subcontractors to do the work and rebuilt city infrastructure for half the cost of neighboring Atlanta County area. 90 miles of roads, 100 miles sidewalks and park trail, 2 playgrounds. Sewer, water and power lines.
Jersey City , New Jersey contracted its water pipe rebuilding project to a private water contract for bids. Private firm saved taxpayers 46 million dollars. When the city ran the water debt. They couldn’t control the price increases. Let alone fix pipes…..Can’t be done….it’s an answer heard on bureaucracies everywhere, now the laid off public workers now work in private sector. THEY DO precisely what government said was impossible.
ONE reason why construction costs so much, Labor costs.
Europe builds Lots of trains, so they invest a lot of money in industrial infrastructure and manufacturing capacity fo rail equipment, track, trains, cars, furnishings, etc. By contrast the US uses almost NO passenger trains so investment is significantly lower.
Europe was fighting labor costs they invested in automation like track laying machines and large modular building techniques.
– Europe uses technology to fight labor costs of infrastrructure building, that and imported immigrants
– Asia fights labor costs with population, they drag down labor cost by replacing with manual workers. China can build a labor intensive project digging tunnels with spoons………
Middle East does it with imported laborers from places as far as the Phillippines then saddles them with debts to pay for their upbringing then deports them.
All in all Asia/mideast use slave labor to get shit done.