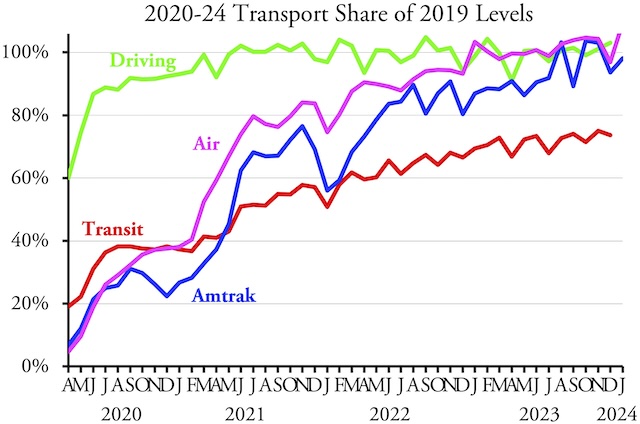
June Transit Carried 71% of Pre-COVID Riders

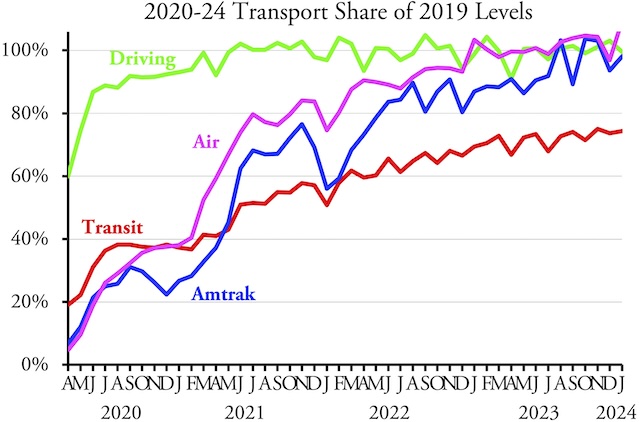
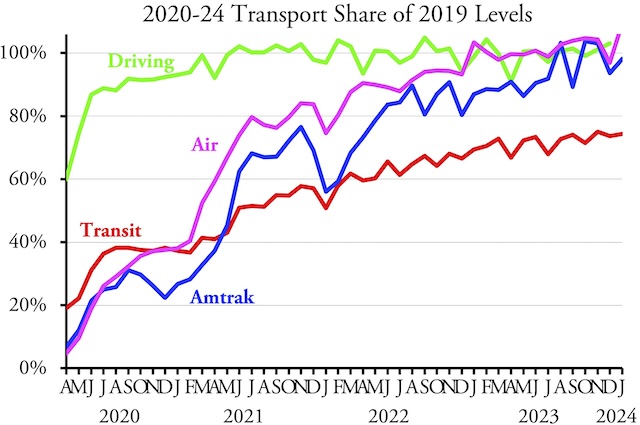
America’s transit agencies carried 71.4 percent as many riders in June 2023 as they did in the same month of 2019, according to data released by the Federal Transit Administration yesterday. This is the highest percentage of 2019 ridership since February, 2020. One reason for the gain above previous months is that June had two more business days in 2023 than it did in 2019.

Data are not yet available for highway or Amtrak travel. However, boarding numbers from the Transportation Security Administration indicate that the airlines carried 100.8 percent as many riders in June of 2023 as June of 2019. I’ll post updates for driving and Amtrak when those data are released. Continue reading

Amtrak Carried 86% of Pre-Pandemic PM in May

Amtrak carried 492 million passenger-miles in May 2023, which was just 86.4 percent of the 569 million passenger-miles it carried in the same month of 2019, according to Amtrak’s latest monthly performance report. Considering that Amtrak’s April passenger-miles were nearly 91 percent as many in 2023 as 2019, this is a disappointing result. Since Amtrak ridership usually usually picks up in May due to increased vacationers, this suggests that Americans aren’t enthusiastic about riding trains for discretionary travel in a post-COVID world.

For detailed comments on transit and highways, see my July 12 post.

All three types of Amtrak trains underperformed in May, with Northeast Corridor trains carrying less than 88 percent of pre-pandemic riders, long-distance trains carrying 85 percent, and state-supported day trains carrying less than 81 percent. It is worth noting that Amtrak is putting most of the money it received for expansion in the infrastructure bill into state-supported trains even though they are the worst-performing part of its network. Amtrak’s reasoning is that Congress gave it money for capital improvements but not operating costs, so it will need to persuade the states to pay for operating costs of any new routes or increased frequencies. Continue reading

Fixing the Failed the Music City Star

The Regional Transportation Authority of Nashville is asking members of the public how the agency can make its commuter train more convenient to riders. The train, once called the Music City Star but since renamed the much less evocative WeGo Star, was supposed to carry 700 round trips a day in its first year but the closest it came was in 2018 when it carried 581 round trips a day.

In 2021, this fell to a mere 69 round trips a day. The transit agency, which also calls itself WeGo, spent $4 million operating the line but earned less than $142,000 in revenues, which works out to an operating subsidy of more than $108 per rider. The agency claims ridership is currently up to 200 round-trips a day, but even if that’s true it still represents subsidies of around $35 per rider. Continue reading

Is Telecommuting More Productive?

A few weeks ago, the Economist gravely announced that people working at home were less productive than people who commuted to a workplace. I didn’t find its evidence persuasive, however, as the studies it cited mostly dealt with low-skilled jobs such as call centers and data entry.

Click image to download a 17.4-MB PDF of this report from the McKinsey Institute.

Yesterday, the Hill reported just the opposite: telecommuting, a new study has shown, increases worker output. This is partly because remote workers save a lot of time by not having to commute, and they tend to spend almost half of that time working. The article also pointed out that overall worker productivity is higher now than before the pandemic, and telecommuting is one of the factors increasing that productivity. Continue reading

Houston BRT Failure

A Houston bus rapid transit route over dedicated bus lanes is attracting less than 10 percent of the riders that were projected for it. The Silver Line opened in August 2020 with the expectation that it would carry 14,850 weekday riders, but in fact it is carrying less than 900 riders per weekday, about 6 percent of projections.

A Houston Silver Line sits empty, which is not unusual for it even when in motion. Photo by Ricky Courtney.

Metro, Houston’s transit agency, originally wanted to put a light-rail line in the Silver Line corridor, but opposition from local residents led it to “downgrade” the line to bus rapid transit. According to Houston businessman Bill King, Metro still managed to spend $200 million on the 4.7-mile route, mostly through tax-increment financing. This was a lot less than the $500 million or so that light rail would have cost but still a lot more than necessary. Continue reading

Transit’s Minuscule Share of 2021 Travel

Public transit carried 6.4 percent of 2021 motorized passenger travel in the New York urban area. It also carried 1.6 percent in Honolulu, 1.5 percent in San Francisco-Oakland, 1.4 percent in Seattle, 1.2 percent in Chicago, and 1.1 percent in Salt Lake City. In every other urban area it carried less than 1 percent; nationwide, transit carried just 0.7 percent of all motorized urban travel.

Chicago transit carried 1.2 percent, autos the other 98.8 percent of motorized passenger travel.

I calculated these numbers by comparing passenger-miles in the 2021 National Transit Database, which was released last fall, with daily vehicle miles of travel (DVMT) by urban area in table HM-72 of Highway Statistics, which was recently released by the Federal Highway Administration. To make the numbers comparable, I multiplied DVMT by 365 to get annual data and by 1.7 to account for vehicle occupancies, 1.7 being the result when dividing passenger-miles by vehicle-miles in Highway Statistics table VM-1. These numbers don’t include walking, bikes and e-bikes, or scooters, but they do include motorcycles. Continue reading

Cities More Accessible in U.S. Than Europe

“Should the U.S. repair crumbling roads and highways to enhance car-based mobility or replace them with new public transit infrastructure that re-orients U.S. commuting systems away from their current car dependence?” asks a paper recently published by the National Bureau of Economic Research. To answer the question, the paper compared accessibility via transit and driving in about 50 U.S. and 50 European cities. If transit made European cities more accessible, the researchers reasoned, then it would make sense for the U.S. to emphasize transit as well.

Should the United States attempt to build as much transit infrastructure as is found in Europe even if doing so reduces people’s access to jobs and other economic opportunities?

Instead, the researchers — two economists from Yale and one from UC San Diego — found that U.S. urbanites had far more access to their cities than Europeans did in theirs. Moreover, Europeans using cars had far more access to their cities than those who relied on transit. This shouldn’t be a surprise to those familiar with the research published by the University of Minnesota’s Accessibility Observatory, but it seems to have surprised the people doing this research. Continue reading

Purple Line Seven Years Late at Triple the Cost

Maryland state officials failed to indicate the slightest degree of embarrassment when they announced on Friday that the Maryland Purple light-rail line will be delayed again until Spring 2027 and cost an additional $148 million. When originally approved, the line was expected to cost just over $1.9 billion and to open in mid-2020. Even at that price it made no sense; although nobody but the Antiplanner read the full EIS, that document admitted that the line would significantly increase traffic congestion in Washington DC suburbs.

The executive summary of the Purple Line draft environmental impact statement implied that the purpose of the line was to reduce congestion, but a technical appendix calculated that it would make congestion far worse. However, hardly anyone but the Antiplanner bothered to read that appendix. Click image to go to a list of environmental documents and technical reports written for this boondoggle.

Now the line is $3.8 billion over budget, meaning it is costing about three times as much to build as originally projected. That number comes with a qualifier, however. Maryland is building the line through a public-private partnership in which it is contracting to the private partner to not only build it but to operate it for 30 years. The cost of the contract was originally supposed to be $5.6 billion and now is up to $9.4 billion but state officials refuse to say what portion of that is construction and what portion is operating costs. While it is possible that the operating costs grew which means the construction cost less than tripled, the $148 million increase includes a $205 million increase in construction costs and a $57 million reduction in operating costs. Continue reading

Honolulu Says It Underreported Riders

The Honolulu Authority for Really-overpriced Transportation (HART) says that early reports of ridership on its new rail line only included people who paid full fares but not people who boarded with a transit pass. When all riders are counted, the rail line carried about 4,000 riders a day in its first week, about double its early reports.

Another nearly empty train obstructs views in Honolulu. Photo by HART.

Even 4,000 is a little short of the number that HART projected it would attract once the system is completed: 84,000 people a day. Unfortunately, the agency hasn’t published ridership estimates for the portion of the line that opened on June 30, but I doubt they would be anywhere near as low as 4,000 a day. Continue reading

Who’s to Blame for This?

A video is going around of a Charlotte streetcar being delayed because someone left their car parked on the tracks.

The Antiplanner’s question is: who should be more embarrassed? The idiot driver who left their car on the tracks? Or the idiot transportation planner who thought it was a good idea to spend $150 million on a streetcar that can’t go around obstacles in the road when for a tiny fraction of that money the same (or better) service can be provided by buses that can easily drive around parked cars? Continue reading