Amtrak Carried 108.6% of 2019 PM in June 2024

Amtrak carried 654 million passenger-miles in June of 2024, an 8.6 percent increase over the same month in 2019, according to the state-owned company’s monthly performance report issued last Friday. Amtrak passenger-miles have been ahead of pre-pandemic numbers for every month since February 2024.

See last week’s post for transit results. Data are not yet available for driving but will be posted here as soon as they are.

Last week, I noted that the Transportation Security Administration counted 7.4 percent more airline passengers in June of 2024 than 2019. This number is not strictly comparable to the Amtrak number as this is passengers while the Amtrak number is in passenger-miles. The Bureau of Transportation Statistics keeps track of airline passenger-miles but releases the data nearly two months after Amtrak. Continue reading

Don’t Invest in a Light-Rail Boondoggle

Last week, I observed that “Transit’s failure to recover from the pandemic is due largely to its downtown-centric orientation in most urban areas.” An op-ed in yesterday’s Baltimore Sun makes a similar point about the planned Red Line light-rail project for that city. “The problem with Baltimore transit is not that it doesn’t have enough expensive rail lines; it is that its route map is mired in the past,” said the op-ed. “Most of its routes focus on downtown Baltimore.”

Rooted in the past: Baltimore’s light-rail system. As an aside, the Orioles ad features steam locomotive wheels because the Orioles play at Camden Yards Stadium, which was built on a former Baltimore & Ohio freight yard, with B&O’s passenger station incorporated into the station. Photo by Mr.TinMD.

This isn’t entirely a coincidence since the Antiplanner wrote the op-ed. “Before the pandemic, more than 20 percent of downtown Baltimore workers commuted by transit, while less than 6 percent of the rest of the region’s workers commuted on transit,” says the article, echoing what I wrote here last week. “The system’s downtown orientation simply does not work for 94 percent of non-downtown workers.” Continue reading

Transit Carried 74.9% of 2019 Riders in June

After creeping up above 75 percent of pre-pandemic ridership for the first time in May, transit ridership fell back down to 74.9 percent in June, according to data released by the Federal Transit Administration on Tuesday. Meanwhile, air travel continued soaring at 7.4 percent above pre-pandemic numbers, according to TSA counts.

Data are not yet available for Amtrak and driving but will be posted here as soon as they are.

Transit’s failure to recover from the pandemic is due largely to its downtown-centric orientation in most urban areas. Before the pandemic, almost half of all transit commuters in the nation’s 50 largest urban areas worked downtown, and almost half of downtown workers commuted by transit whereas less than 6 percent of non-downtown workers used transit to get to work. Although less than 10 percent of urban employees worked downtown, transit didn’t work for most of the other 90 percent. Continue reading

Electric Buses Not a Panacea

Last week, the city of Seneca, South Carolina decided to shut down the Clemson Area Transit System, which served Seneca and nearby Clemson University. Once touted as owning the world’s first all-electric bus fleet, just a few years later two thirds of its expensive electric buses had broken down, the company that made them went bankrupt, parts were no longer available, and the city can’t afford to buy replacement buses.

Seneca is not exactly a major metropolis. But Clemson Area Transit isn’t the only transit agency to have trouble with electric buses. Just the day before Seneca decided to shut down its transit system, Austin’s Capital Metro announced that it was giving up on its plan to electrify its bus fleet by 2030. Electric bus technology, said the agency, simply hasn’t progressed far enough to replace Diesels. Continue reading

Hopes Dim for Brightline

Ridership on Florida’s Brightline passenger trains has more than tripled since the company opened its extension to Orlando last September. However, that increase hasn’t been enough to cover costs, as the company reported losing $116 million in the first three months of 2024. This is more than double the $53 million it lost in the first quarter of 2023, indicating that expenses increased by nearly three times as much as revenues.

Brightline’s station at Orlando International Airport. Photo by elisfkc.

When the Orlando line opened, Brightline predicted that it would carry 7.0 million passengers in 2024. However, it has recently reduced that estimate to 5.5 million. One problem is that Brightline has had to turn away passengers in the “short-distance” Miami-West Palm Beach segment of its route in order to keep seats available for the “more profitable long-distance” travelers to or from Orlando. As of May, year-to-date revenue in the short-distance segment declined from $18.8 million in 2023 to $17.2 million in 2024. Continue reading

BART: Give Us More $ So We Can Do Less

Before the pandemic, the San Francisco Bay Area Rapid Transit District (BART) earned more than 70 percent of its operating costs out of fare revenues, more than any transit agency in the nation other than CalTrain. Ironically, this also made it most vulnerable to a ridership downturn, while agencies like San Jose’s Valley Transportation Authority, which covered only 9 percent of its operating costs out of fares (the fourth worst among the nation’s transit agencies), were relatively immune. Now BART is pleading for more money so it won’t have to dramatically reduce service as it exhausts federal COVID relief funds.

Click image to download a 12.6-MB PDF of this report.

As part of that plea, BART published a report on its role in the Bay Area earlier this week. The report admits that BART’s ridership has dropped — as of May, it carried less than 45 percent as many riders as before the pandemic — due to increases in remote work. “BART ridership is closely linked to office occupancy rates,” says the report, with an accompanying graphic showing that ridership has moved in almost exact parallel to San Francisco-Berkeley-Oakland office occupancies. Continue reading

FRA Puts Price Tag on Overnight Amtrak Routes

The Federal Railroad Administration (FRA) estimates that adding 15 new overnight routes to Amtrak’s system will cost taxpayers $46 billion to $59 billion (see pages 80 to 159 of this 18.8-MB file) plus increase Amtrak’s annual operating costs by $1.1 billion to $1.6 billion. The FRA did not estimate ridership or fare revenues, but it did estimate that adding these routes would reduce driving by 0.014 percent and the annual number of highway accidents by 0.016 percent.

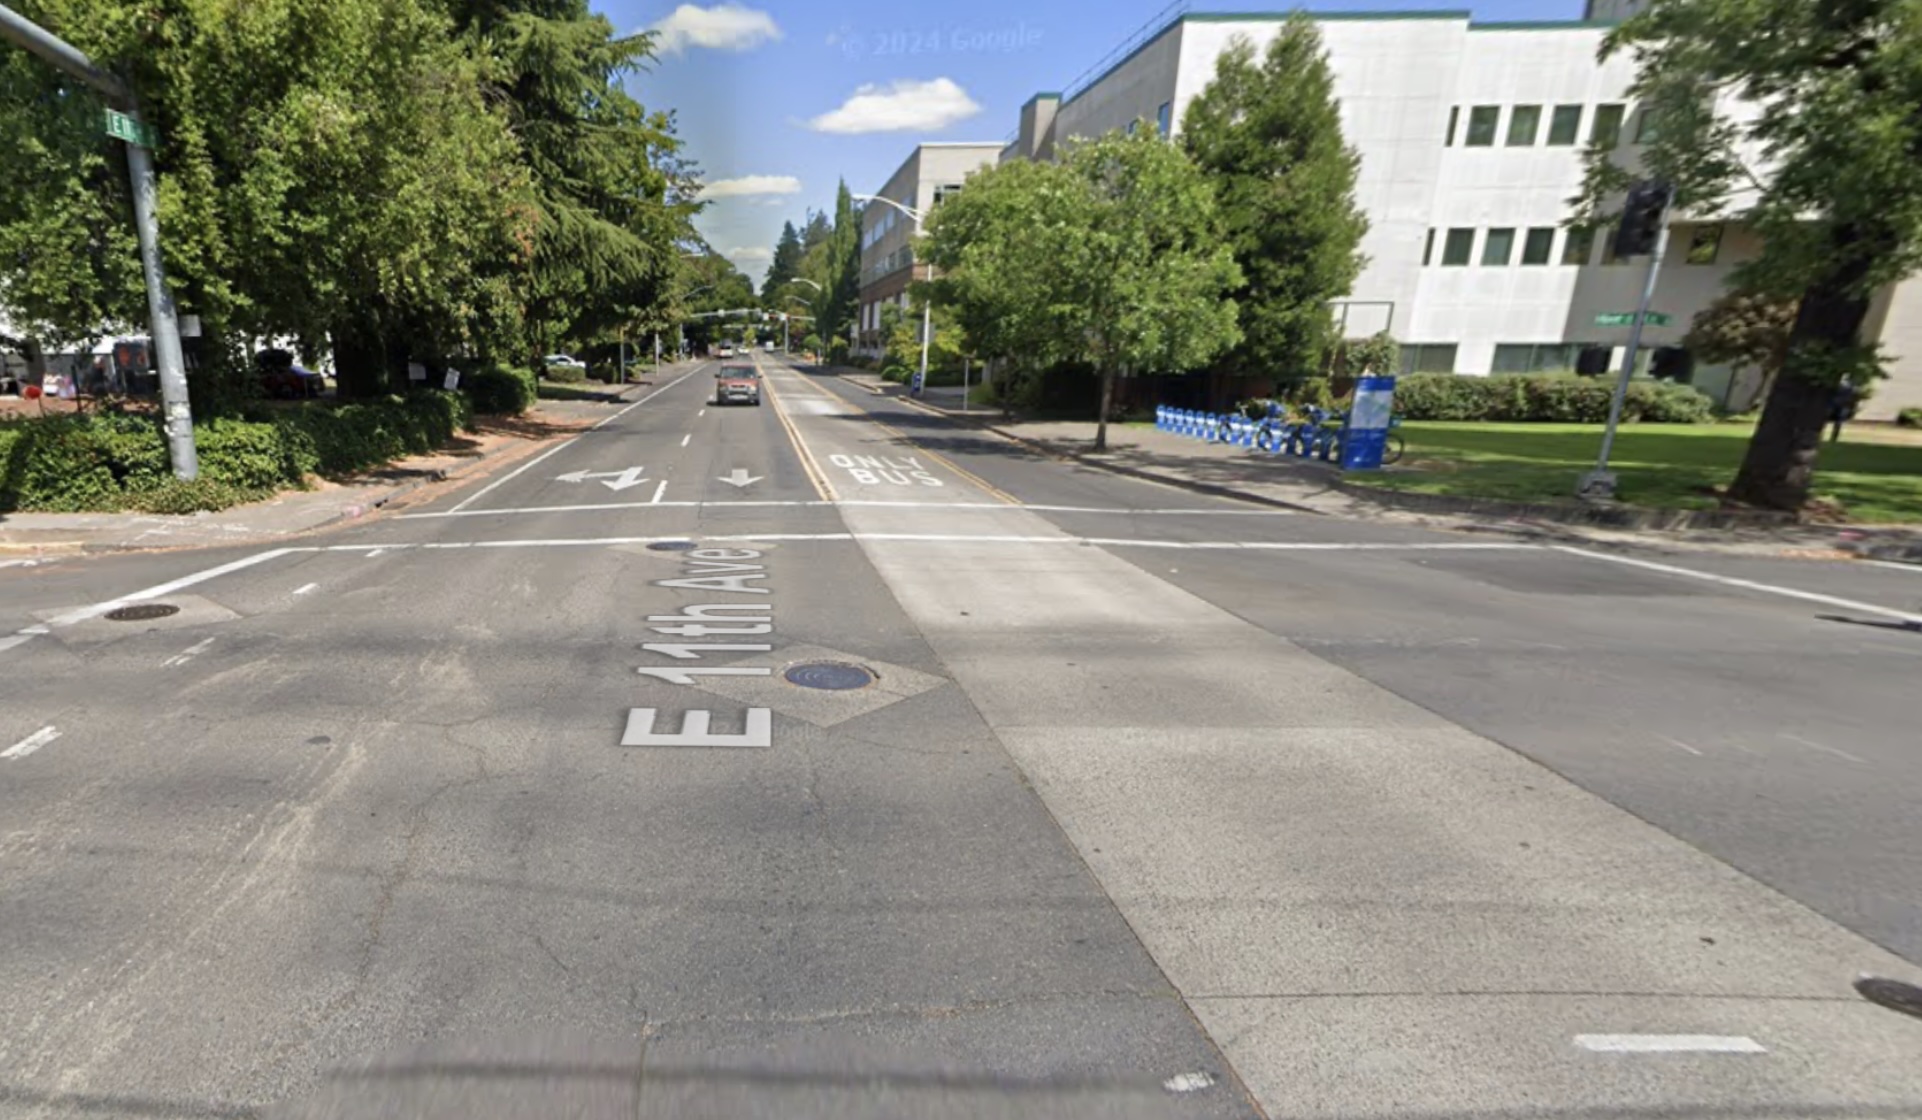
Click image for a larger view.

Amtrak currently has 15 overnight train routes that carried just over 2.0 billion passenger-miles in 2023 (see page 7). These routes cost $1.3 billion to operate in that year (not counting depreciation) and earned just under $600 million in fare revenues. Amtrak admits all of them except the Virginia-Florida Auto Train lost money, and when depreciation is counted that train probably lost money as well. Continue reading

Driving, Air Travel Surge Above Pre-COVID Levels

Americans took 7.7 percent more airline trips in May 2024 than the same month in 2019, according to TSA passenger counts. While the release of airline passenger-mile data lags other data by a couple of months, March data indicate that domestic flying passenger-miles were 5.5 percent greater than in 2019 while international passenger-miles were 1.5 percent short of 2019. The number of international trips was 4.3 percent greater than in 2019, indicating that people who are traveling internationally are going to closer destinations.

Americans also drove 2.6 percent more miles in May 2024 than May 2019, according to data released last week by the Federal Highway Administration. Rural miles of driving were 8.8 percent greater than before the pandemic while urban miles were just 0.2 percent short of May 2019. Continue reading

Is Bicycling Improving?

One of my many beefs with government planning advocates is that they tend to judge success by measuring inputs rather than outputs. A case in point is a group that calls itself People for Bikes that issued a report last week that claims that Bicycling Is Improving in Cities Across the U.S.

New bike lanes, but are they really safe?

Does it measure that improvement by the number of people cycling in those cities? Or by a reduction in bicycle fatalities and injuries from traffic accidents? No, it instead measure the miles of bike lanes, the reallocations of street space to dedicated bicycle use, reductions in automobile speed limits, and changes to intersections favoring bicyclists. The fact that these “improvements” have been accompanied by increased bicycle fatalities and reductions in bicycle commuting aren’t considered. Continue reading

Mid-Day Traffic Now Worse Than AM Rush Hour

Morning and afternoon rush-hour traffic has returned to pre-pandemic levels in many U.S. urban areas, according to INRIX’s 2023 Global Traffic Scorecard. However, what INRIX finds most “astonishing” is that mid-day traffic has grown by an average of 23 percent and is now much greater than during the morning rush hour, and almost as great at around noon as the afternoon rush hour.

U.S. Trips by Start Hour in 2019 and 2023

This will only be astonishing to people who haven’t read the several research studies finding that people who work at home drive more miles per day than people commute who work. As the above chart indicates, morning rush-hour traffic in U.S. urban areas is down 12 percent while afternoon rush-hour traffic is down 9 percent; but total traffic is up because of the 23 percent increase in mid-day traffic. Continue reading