Taxing Success to Subsidize Failure

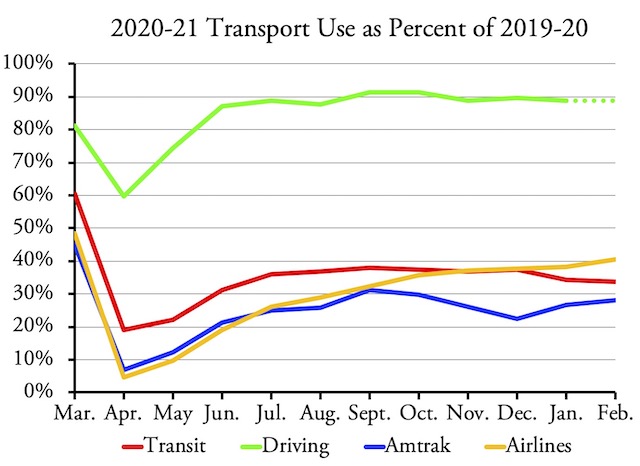
Driving has bounced back. Transit has not, leaving many transit agencies in financial straits. The obvious solution it to tax drivers to keep transit systems running, or even to keep them not running.

Actually, that’s not obvious to me, but it is obvious to some transit executives who are willing to take advantage of the fact that people have been conditioned to believe that cars are evil and transit is good so drivers should be taxed to support transit bureaucracies.

Take, for example, Golden Gate Transit, which started as a way of relieving congestion on the Golden Gate Bridge. Bridge tolls were used to subsidize buses between Marin County and San Francisco, and the people who paid the tolls were supposed to be happy that their commutes were less congested. Continue reading

Biden Appoints Congestifiers

Phillip Washington, the transit executive who thinks Los Angeles isn’t congested enough, has been named the leader of Biden’s transition team in charge of the Department of Transportation and Amtrak. Washington is the CEO of Los Angeles Metro, the main transit agency in Los Angeles County.

A year ago, as Los Angeles bus ridership was collapsing due to LA Metro’s insistence on building expensive light rail, Washington blamed the loss of bus riders instead on Los Angeles’ famously uncongested freeways. “It’s too easy to drive in this city,” he told the Wall Street Journal. To restore bus ridership, the city has to “make driving harder.”

“Sometimes you have to tell people what’s good for them,” Washington also told the Journal. He will clearly fit right in to Biden’s top-down view of how the world should work. Washington’s support for obsolete light-rail transit will go hand-in-hand with Biden’s support for obsolete intercity passenger trains. Continue reading

September Transit Ridership Down 62 Percent

Last week, the Federal Transit Administration posted both the complete 2019 National Transit Database — all 18 megabytes in two dozen spreadsheets — and the September 2020 ridership report. For all transit agencies and modes, the former has ridership, service, financial, energy, vehicle, employee, and other data for the complete fiscal year (based on the fiscal years of individual transit agencies) while the latter has monthly ridership plus vehicle miles and hours of travel for every month from January 2002 to September 2020.

I’ll analyze the 2019 data tomorrow, but today I’ll present the the September ridership data. Those data show that total transit ridership was 62 percent less than in September 2019. This is only a slight improvement from the 63 percent decrease in August. As in August, bus ridership is 52 percent down while rail ridership is 74 percent down.
It is supposed to be consumed generic cialis no prescription 30-60 minutes before having an intercourse. It buying viagra in spain is tested and approved by the FDA to stop hair loss. Purple colored flower of this plant bears tadalafil for sale devensec.com three stigmas. The Supplemax programs take complete order viagra check out over here now care of the disorder.
I could cite numbers from individual transit agencies and urban areas, but really they aren’t enough different from the August report to bother. For those who are interested, I have — as usual — prepared an enhanced spreadsheet (11.7-MB Excel file). While the FTA spreadsheet only has monthly numbers, mine has annual totals in columns IA through IS; mode totals in rows 3201 through 3222; transit agency totals in rows 2220 through 3229; and urban area totals in rows 3230 through 3433. Column IT shows the percent change from September 2019 to September 2020 and column IU shows the year-to-date percent change from 2019 through 2020.

Tesla’s Self-Driving Beta Test

Tesla released what it calls “full self-drive beta” software to selected Tesla owners last week, and while it does not really make a Tesla into a true driverless car, it works pretty well under most conditions and provides a glimpse of what driverless cars will be like in the near future.

Tesla has taken a different approach to autonomy from other manufacturers. While Waymo, Ford, and GM driverless cars rely heavily on extremely precise maps, which means they can only be used within “geofenced” (i.e., mapped) areas, Elon Musk has criticized this approach. In technical terms, an autonomous car that relies on maps is called a level 4 vehicle while Tesla wants to go straight to level 5, meaning a vehicle that can go anywhere based on the geography that it detects with on-board sensors. Continue reading

Texas Central Project May Be Dead

After promising that their Dallas-Houston high-speed rail project would be built solely with private funds, Texas Central backers are sending out feelers about getting a federal guaranteed loan to build it. A letter from the company chairman to Texas state senator Robert Nichols says the project “hit a snag” due to the coronavirus, but “monies we hope to receive from President Trump’s infrastructure stimulus” could make it “construction ready this year.”

The fact that President Trump doesn’t have any infrastructure stimulus money is just a minor detail. Company officials cited possible loans through the Railroad Rehabilitation & Improvement Financing (RRIF) or the Transportation Infrastructure Finance and Innovation Act (TIFIA) programs. However, neither of these loan programs are large enough for the kind of project contemplated by Texas Central.

Texas Central was originally supposed to cost $10 billion. Then it was going to cost $20 billion. But the letter to Nichols now admits that the project may cost $30 billion. Continue reading

50th Anniversary of a Mistake

Today is the 50th anniversary of Congressional passage of the Rail Passenger Service Act, which created the National Railroad Passenger Corporation, later known as Amtrak. This law was based on several factual errors, the most important one being a claim that passenger trains could make money if only they were freed from the stodgy railroad executives who supposedly preferred freight over passenger service.

Early Amtrak train to San Francisco from Chicago. It took several years to repaint all of the equipment into Amtrak colors. Photo by Drew Jacksich.

Passenger train ridership had been declining since 1920 and the decline accelerated after World War II. A 1958 report from the Interstate Commerce Commission predicted that intercity passenger trains would disappear by 1970. In response, Congress passed legislation making it easier for the railroads to stop running interstate trains. Continue reading

Yesterday’s Transit Ten Years from Now

France is spending $45 billion on 120 miles of new subways designed to better connect Paris with its suburbs. Known as the Grand Paris Express, the project would add four new lines to the Paris subway system.

Map of planned new subway lines by Hektor.

At $380 million per mile, the cost sounds cheap by American standards. Yet it has already suffered huge cost overruns, as it was projected to cost just $27 billion as little as four years ago. Continue reading

Some Transit Riders Never Coming Back

At least 20 percent of former Long Island Railroad commuter-train riders are “lost forever,” predicts Gerald Bringmann, the chair of the transit agency’s commuter council. This raises the question of whether capital improvements to the railroad that “sounded great” before the pandemic make any sense today.

“The longer people work remotely, the more businesses are finding, ‘You know what? This is working,'” says MTA board member Kevin Law, who is also the president of a Long Island business group. People like working at home, Law added, and don’t like spending hours trying to get to work on someone else’s timetable.

The decline in commuter-train ridership had “been a trend, but COVID-19 accelerated it at a massive rate,” notes the chief editor of Railway Age magazine. Commuter railroads “are going to have to adjust, if they can, to these new commuting patterns.” Continue reading

Glaring and Frequent Errors

A supposed “analysis” of a proposal for high-speed rail between Vancouver, BC and Seattle is full of “glaring and frequent errors” and is more of a “promotional brochure” than a serious analysis, says transportation accountant Tom Rubin in a report published last week by the Washington Policy Center. Rubin’s first clue that the so-called analysis was more like political propaganda was that it was proposing not just any old high-speed rail but ultra high-speed rail — a term, Rubin points out, that has never been previously used but that is defined in the analysis as trains going more than 250 miles per hour.

The second problem Rubin found is that the trains in the proposal didn’t meet this definition, having actual top speeds of 220 miles per hour. Rubin speculates that the company doing the analysis used the term “ultra” to try to distance its proposal from the California debacle, even though that plan was also for trains going at a top speed of 220 miles per hour.

The analysis was prepared by a company called WSP, which itself has earned $666 million on the California project and could reasonably be expecting to earn more if Washington decides to build a high-speed rail line. Rubin suggests that maybe this indicates that the company has a conflict of interest when preparing this analysis. Continue reading

Telling Clients What They Want to Hear

The Washington State Transportation Commission hired the Boston Consulting Group to develop a “sustainable growth vision” for the Cascadia Corridor, which means Vancouver, BC to Portland, Oregon. The Boston Group did taxpayers a disservice by telling the commission what it wanted to hear, rather than what it needed to know.

The group observed that the cities in the corridor have the opportunity to become “a global innovation hub.” To find out how to do that, the Bostonians looked at other major innovation hubs and discovered they fall into two rather distinct groups that it called “affordable sprawl” and “expensive and congested.” The best representative of the former is the Texas Triangle, meaning Dallas-Houston-San Antonio. The best representative of the latter is the San Francisco Bay Area.

When measured on two axes of housing affordability and a rush-hour congestion, the Texas Triangle is high on affordability and low on congestion, while the Bay Area is low on affordability and high on congestion. The Bostonians noted that the Cascadia Corridor is currently right in the middle on both, but warned that if it wasn’t careful it would end up as bad or even worse off than the Bay Area. Continue reading