Commuting in 2017

The total number of American workers who usually commute by transit declined from 7.649 million in 2016 to 7.637 million in 2017. This continues a downward trend from 2015, when there were 7.761 million transit commuters. Meanwhile, the number of people who drove alone to work grew by nearly 2 million, from 114.77 million in 2016 to 116.74 million in 2017.

These figures are from table B08301 of the 2017 American Community Survey, which the Census Bureau posted on line yesterday. The table also reveals that the number of people who carpool grew from 13.58 million to 13.60 million, while the number who take taxis (which probably includes ride hailing) grew from 226,687 to 303,441. The number of people who walked and bicycled to work both declined.

Transit commuting has fallen so low that more people work at home now than take transit to work. Work-at-homes reported for 2017 total to 7.99 million, up from 7.59 million in 2016. Continue reading

Agencies Respond to Transit Decline

Last May, Nashville voters rejected a proposed light-rail plan by nearly two to one. In 2014, the state stopped a plan to convert existing road lanes to dedicated bus lanes. But that hasn’t stopped the city from coming up with ridiculous new plans for transit.

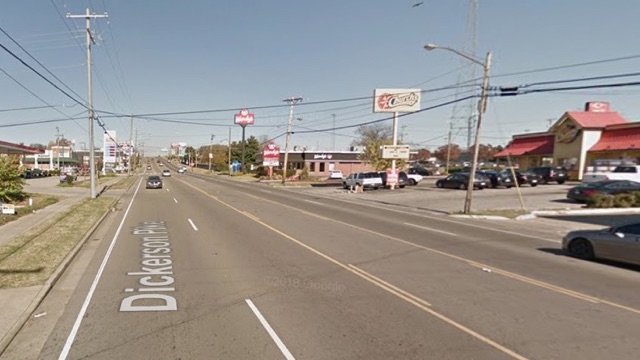
Dickerson Pike today.

The city is proposing to convert two of the five lanes on Dickerson Pike into bus-rapid transit lanes. The city expects the corridor’s population to grow by 35 percent in the next two decades, which means any congestion today will be much worse in the future. That certainly won’t be helped by reducing the number of lanes by 40 percent. Continue reading

Transit Is About Downtown

The Antiplanner’s faithful ally, Wendell Cox, likes to say that “transit is about downtown.” This is because most transit lines represent spokes focusing on a downtown hub, making it easy for people throughout an urban area to take transit downtown, but difficult for them to get from anywhere outside of downtown to somewhere else that is outside of downtown.

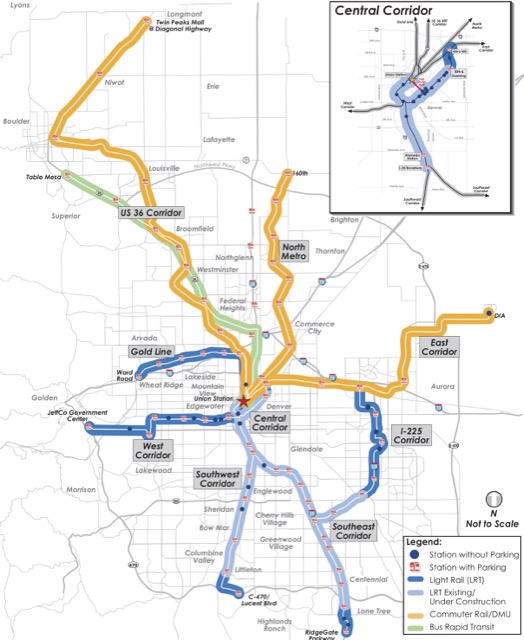
This can be seen in the above map of Denver’s 2004 rail transit plan known as FasTracks. All of the rail lines but one converge on downtown Denver, where about 20 percent of the 120,000 workers take transit to work. Even though downtown has less than 10 percent of the region’s jobs, 40 percent of all transit commuters in the region commute to downtown jobs. (All of these numbers are from Cox’s 2014 Central Business District report, which is based on 2006 data.) Continue reading

Streetcar Roundup

Milwaukee and Oklahoma City are both planning to open new streetcar lines later this year, so it is worth taking a look at how the dumbest form of transit is working in other cities. The table below shows all of the streetcar lines reported in the July, 2018 National Transit Database spreadsheet. Ridership numbers are shown for January and July and annual growth compares the last full year (August 2017-July 2018) with the year before that.

CityRail
Miles
1-18
Riders
7-18
Riders
Annual
Growth
Atlanta2.617,41643,915-16%
Charlotte1.630,16320,291-21%
Cincinnati3.617,22054,625-21%
Dallas-Oak3.611,09816,402-1%
Dallas-McK.4.531,76051,582-9%
Detroit3.384,456116,086
Kansas City2.297,194262,593-1%
Kenosha2.059310,293-5%
Little Rock3.51,5803,413-6%
Memphis10.545,457
New Orleans21.4497,771722,566-6%
Philadelphia217.32,139,2781,819,919-6%
Portland14.8400,370406,9574%
San Francisco21.7517,180863,3907%
Seattle7.9121,995148,2287%
Tacoma2.778,64462,810-3%
Tampa3.525,22126,112-1%
Tucson3.980,34343,4100%
Washington5.687,81688,56613%

Continue reading

July Transit Ridership Up 0.2 Percent

The beleaguered transit industry got a tiny bit of good news with the Federal Transit Administration’s release last Friday of July, 2018 ridership data: nationwide ridership was 0.2 percent greater than in July 2017. Ridership grew in 18 of the nation’s 50 largest urban areas, up from just 6 in June.

July 2018 had one more work day than July 2017, which helps explain the improvement in some of those urban areas. This was the first year-over-year improvement since October, 2017, which also had one more work day than October 2016.

However, the biggest reason for the nationwide increase was the 8.0 percent growth in New York City subway ridership and 6.6 percent growth in New York City bus ridership. July 2017 was the beginning of New York’s “summer of hell” as deteriorating conditions forced the partial closure of Penn Station, the city’s main transit hub, from July 10 to September 1. Many commuters who found alternate sources of transportation during that shutdown apparently returned to transit when the station fully re-opened. Continue reading

APTA: Correlation Proves Causation

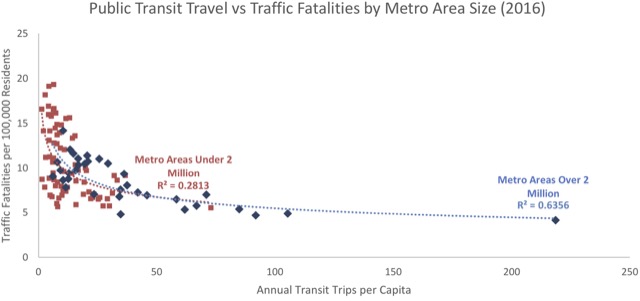
A new report from the American Public Transportation Association (APTA) comes out firmly in support of the belief that correlation proves causation. The report observes that traffic fatality rates are lower in urban areas with high rates of transit ridership, and claims that this proves “that modest increases in public transit mode share can provide disproportionally larger traffic safety benefits.”


Here is one of the charts that APTA claims proves that modest increases in transit ridership will reduce traffic fatalities. Note that, in urban areas with fewer than 25 annual transit trips per capita — which is the vast majority of them — the relationship between transit and traffic fatalities is virtually nil. You can click the image for a larger view or go to APTA’s document from which this chart was taken.

In fact, APTA’s data show no such thing. New York has the nation’s highest per capita transit ridership and a low traffic fatality rate. But there are urban areas with very low ridership rates that had even lower fatality rates in 2012, while there are other urban areas with fairly high ridership rates that also had high fatality rates. APTA claims the correlation between transit and traffic fatalities is a high 0.71, but that’s only when you include New York and a few other large urban areas: among urban areas of 2 million people or less, APTA admits the correlation is a low 0.28. Continue reading

Amtrak vs. Freight Trains

Trains magazine columnist Fred Frailey is an unabashed lover of passenger trains. So when he suggests that Amtrak is unfair to the freight railroads whose tracks it uses, passenger train supporters should listen.

Railfans often blame the freight railroads for late Amtrak trains, saying that the railroads should always give passenger trains priority under a 1973 law that states, “Except in an emergency, intercity passenger trains operated by or on behalf of [Amtrak] shall be accorded preference over freight trains in the use of any given line of track, junction, or crossing.” But, as Frailey points out (paywall), that 1973 law may be effectively stealing from the railroads when they are running near or at capacity.

For example, the oil boom is generating huge business for BNSF in western North Dakota. BNSF’s east-west main line across North Dakota has a single track with sidings, which should be able to support around 48 trains a day. But Amtrak’s Empire Builder is scheduled to run at 79 miles per hour, while freight trains typically run at only about 59, and the difference in speed means that the Amtrak train effectively reduces the line’s capacity by two or more freight trains a day. Continue reading

The Antiplanner’s Library:
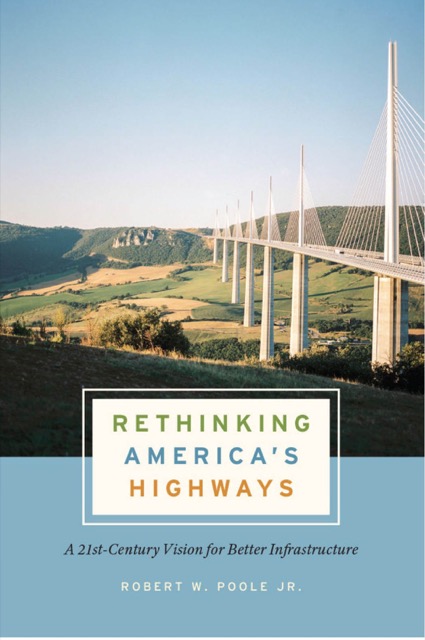
Rethinking America’s Highways

In 1985, Reason Foundation co-founder and then-president Robert Poole heard about a variable road pricing experiment in Hong Kong. In 1986, he learned that France and other European countries were offering private concessions to build tollroads. In 1987, he interviewed officials of Amtech, which had just invented electronic transponders that could be used for road tolling. He put these three ideas together in a pioneering 1988 paper suggesting that Los Angeles, the city with the worst congestion in America, could solve its traffic problems by adding private, variable-priced toll lanes to existing freeways.

Although Poole’s proposal has since been carried out successfully on a few freeways in southern California and elsewhere, it is nowhere near as ubiquitous as it ought to be given that thirty years have passed and congestion is worse today in dozens of urban areas than it was in Los Angeles in 1988. So Poole has written Rethinking America’s Highways, a 320-page review of his research on the subject since that time. Poole will speak about his book at a livestreamed Cato Institute event this Friday at noon, eastern time. Continue reading

Why Is America Keeping Transit Alive?

CityLab‘s article, How America Killed Transit, concludes that “service drives demand.” What the writer, an urban planner named Jonathan English, means is that more frequent service results in more riders, and he bemoans the fact that cities like Washington, Atlanta, Portland, and Dallas that built expensive rail systems failed to support those systems with frequent feeder buses.

Yet English (whose twitter handle is @englishrail) fails to realize that the reason why service is often poor is that rail construction is so expensive that transit agencies didn’t have enough money left over to provide decent bus service. That’s why transit’s share of commuting was growing in Houston and Phoenix before they built rail and declined afterwards, and why it grew in Las Vegas, which didn’t build rail, even as it declined in Denver and Salt Lake City, which did.

Yet English’s larger premise, that “America killed transit,” is simply wrong-headed. America didn’t kill transit; new technologies did. When he claims we didn’t provide enough service, what he really means is we didn’t provide enough subsidies. But at some point there are diminishing returns to subsidies, and when you are already paying a dollar or more per passenger mile, you are beyond that point. Continue reading

Suffering from an Illusion of Safety

The Antiplanner has previously questioned bicycle lanes because they create an illusion of safety from overtaking cars when in fact the real danger is cross-traffic. Unfortunately, I received a very physical demonstration of this while cycling in Maui last Friday when I was hit by a large van.

I was enjoying a tailwind in the bike lane shown on the right side of this photo. The auto lane had bumper-to-bumper traffic while I was traveling at least 20 mph and passing cars that were going much slower. The van was in the left-turn lane where the red car is located in the above photo. Someone was nice enough to leave a gap for the van to turn left, but their car also blocked my view of the van just as they blocked the van driver’s view of me. Continue reading