Housing Preferences by Age

Supposedly, young people today prefer to rent multifamily housing over buying single-family housing. This claim is used to justify policies aimed at densifying cities by rezoning neighborhoods of single-family homes for multifamily housing. As the New York Times Timothy Egan writes, “An unholy alliance of socialists and developers threatens to destroy the city’s single-family neighborhoods with a major upzoning.”

Data from the 2017 American Community Survey can help put this claim to the test. Table B25125 breaks down housing into six types: single-family, multi-family, and other (mobile homes, boats, RVs, vans), each owned or rented, and reports for householders (one of the adults in the household) of ages 15-34, 35-64, and 65-plus. We can compare the results with table HCT004 from the 2000 census to see how young people (and middle-aged and seniors) lived in 2017 vs. how they lived 17 years before.

In 2017, 29 percent of householders under 35 owned and 20 percent rented a single-family home, while 2 percent owned and 44 percent rented multifamily housing. But that’s not much different from 2000, when 31 percent owned and 16 percent rented a single-family home and 2 percent owned and 42 percent rented multifamily. Continue reading

Closing the Black-White Homeownership Gap

Homeownership rates in the United States peaked in 2004 at a little over 69 percent, then declined after the financial crash to less than 63 percent in 2016. Since then they have risen slightly to above 64 percent in late 2017 and 2018.

When broken down by the race of the householder, non-Hispanic white rates have been 6 to 8 percentage points higher than the national average, while black rates have been 20 to 22 percentage points lower. Between 1995 and 2004, blacks closed some of the gap, going from under 60 percent to more than 65 percent of the rates enjoyed by non-Hispanic whites. After the financial crash, however, blacks lost more than they had gained in the previous decade, with rates falling below 58 percent of non-Hispanic white rates in 2016.

Black rates made a slight recovery in 2017, according to the American Community Survey. Table B25003 shows homeownership rates, B25003B has rates for black householders, and B25003H has rates for non-Hispanic whites. There are also tables for whites including Hispanic (B25003A); Indian/Native Alaskan (C); Asians (D); and Native Hawaiian/Pacific Islander (E). But I’m focusing on blacks and non-Hispanic whites as economic bellwethers. Continue reading

America’s Racist Urban Areas

John Oliver recently had an article saying that Boston was one of the most racist cities in America. But, if that’s true, why are so many blacks moving there? According to the American Community Survey, the city of Boston’s black population grew by 26 percent in the last 11 years, and black numbers are growing faster than the city’s overall population.

In 2015, the Antiplanner argued that the amount of racism in an area can be inferred by whether minorities are moving into or away from that area. This means regions can be racist if they adopt policies that have the effect of driving minorities away even if that wasn’t the main intention of those policies. At that time, the Antiplanner found that San Francisco-Oakland was the nation’s most-racist urban area as its overall population grew by nearly 10 percent between 2000 and 2010, but its black population shrank by 14 percent, a bigger gap than any other urban area. Continue reading

Notes from All Over

Tomorrow the Antiplanner will review more 2017 census data, but today I’ll briefly comment on a few events that took place while I was reviewing census data last week. First, the New York Metropolitan Transportation Authority is blaming subway delays on the passengers, claiming that late-arriving riders sticking their feet in the doors as they are closing are responsible for slow trains. Because no one ever did that before this year!

Speaking of the MTA, a member of MTA’s board is suing Mayor de Blasio and New York policy commissioner James O’Neill for their failure to release data on subway fare evaders. Because it is easier to blame financial problems on someone else than it is to actually do your job of overseeing the agency’s finances.

Speaking of fare evaders, San Francisco’s Muni is upset to discover that one out of four transit riders on the city’s famous cable cars aren’t asked if they have paid their fares. Since most riders pay before they board, this doesn’t mean that one in four haven’t paid, only that they haven’t had their tickets checked by the conductor. Continue reading

The Sordid History of Forest Service Fire Data

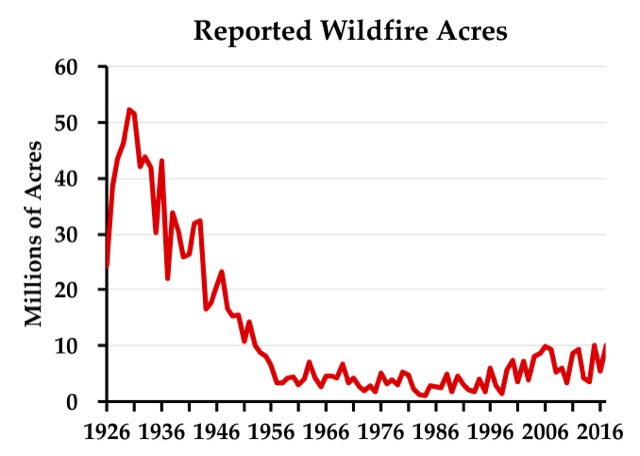
The latest wildfire situation report indicates that about 7.3 million acres have burned to date this year. That’s about 1.2 million acres less than this same date last year, but about 1.5 million acres more than the ten-year average and a lot more than the average in the 1950s and 1960s, which was about 3.9 million acres a year.

Some people use the data behind this chart to argue against anthropogenic climate change. The problem is that the data before about 1955 are a lie. Click image to go to the source data.

While some blame the increase in acres burned on human-caused climate change, skeptics of anthropogenic warming have pointed out that, according to the official records, far more acres burned in the 1930s — close to 40 million acres a year — than in any recent decade. The 1930s were indeed a decade of unusually bad droughts that can’t be blamed on anthropogenic climate change. Continue reading

Housing Affordability in 2017

Despite all of the weeping and wailing and declarations of housing crises, housing affordability reported by the 2017 American Community Survey did not change significantly from the 2016 survey. However, it is important to keep in mind that the financial data reported in each survey is from the previous year, so data reported in September 2018 from the 2017 survey is actually for 2016.

The most common measure of housing affordability is the ratio of median home prices with median family (or median household) incomes. (Family incomes are a little higher than household incomes, and since families, not households — including unrelated people who live together — tend to be homebuyers, the Antiplanner uses family incomes.) A value-to-income ratio below 3 is affordable; 3 to 5 is marginal; above 5 is unaffordable. Table B19113 of the American Community Survey reports median family incomes; table B25077 reports median home values.

The Antiplanner has posted a file showing median home values and median family incomes reported by both the 2016 and 2017 surveys (meaning the data are for 2015 and 2016) for the nation, states, and major counties, cities, and urban areas. Data reported for counties, cities, or urban areas in 2016 but not 2017 are excluded; data reported in 2017 but not 2016 are included with zeroes in the 2016 columns. Continue reading

Travel Time to Work in 2017

The average American commuter spent 25.5 minutes getting to and from work in 2017, a 0.7 percent increase over 2016. Commuters who drove alone took 25.6 minutes, carpoolers took 28.2 minutes, while transit riders required 50.4 minutes. Curiously, the only method of commuting that averaged less than the national average was walking, but at 12.8 minutes it was enough to bring the national average below that of driving alone.

Average time to work was only 21.7 minutes in 1980 and 22.4 minutes in 1990. However, it has been hovering around 25.5 minutes since the 2000 census. One of the reasons for the increase between 1990 and 2000 was that the census data entry system allowed maximum commutes of 99 minutes in 1990 and earlier surveys but 240 minutes in 2000 and later surveys. This was estimated to add 30 seconds to average travel times.

Table B08136 of the American Community Survey reports the total time spent each way by commuters by mode of commuting. Since table B08301 presents the number of commuters by mode, it should be easy to divide one into the other to get the average number of minutes. Continue reading

Motor Vehicle Ownership in 2017

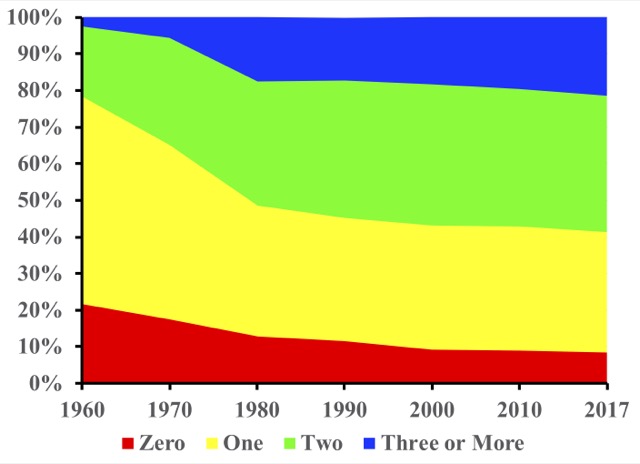
The number of households that lacked access to a motor vehicle declined in 2017 as did the number with only one vehicle. Meanwhile, the number with two or more rapidly grew. In fact, the more vehicles, the faster the growth: the number with two vehicles grew by 1.4 percent; the number with three grew by 2.8 percent; the number with four grew by 4.5 percent; and the number with five or more grew by an astounding 7.2 percent.


The shares of households with no cars and with three or more cars have practically reversed themselves since 1960.

The number with no vehicles declined by only 0.7 percent. But transit ridership is partly dependent on people who lack access to motor vehicles. Since transit carries less than 2 percent of passenger travel in all but a handful of urban areas, a small increase in auto ownership can translate to a large decrease in transit riders. Continue reading

Commuting and Income in 2017

The median income of American workers in 2017 was $36,903, while the average income was around $46,000. Average incomes are always going to be higher than medians because a few people with very high incomes will pull the average up without affecting the median. Since the lowest income people can earn is generally around zero but the highest is might be a thousand times greater than the $75,000 top-income class, the few people with vey high incomes aren’t balanced by people with very low incomes.

This point is important because in a post two months ago the Antiplanner erroneously blurred the distinction between median and average incomes. The post showed that the average incomes of transit riders were higher than the average of all workers, then concluded that “well over half of all transit riders earn” more than the national median income in 2016. That turns out not to be true: it appears that the average incomes of transit commuters began to exceed the national average in about 2008, but the median income of transit commuters did not exceed the national median until 2017.

At least, that’s what I calculate from table B08119 of the American Community Survey. This table shows how many people use various methods of commuting in each of eight income classes, ranging from below $10,000 to above $75,000. The Census Bureau doesn’t actually calculate average incomes, so I made the calculation by assuming that the average income of, say the $15,000 to $25,000 class was $20,000. For the under $10,000 class I used $7,500 and for the above $75,000 class I used $90,000. Continue reading

Transit Commuting by Age

Remember how Millennials and other young people were giving up cars and riding transit instead? It turns out, not so much. In fact, the latest word is that Millennials are the ones who are killing transit, or at least the DC Metro.

This is based on a study by a company called Teralytics. While the study itself isn’t available on line, charts published in the above-linked article indicate that Metro Rail usage by people in the 18-29-year age class dropped 21 percent between April 2016 and April 2018, while declines were successively smaller in successively older age classes, with the 60-year-plus class ridership declining by only 5 percent. Teralytics gathered this data from the movements of cell phones connected to one of the “big four” wireless carriers that serves more than a quarter of the DC population (no privacy concerns here, I’m sure!).

Since the Antiplanner is downloading 2017 American Community Survey data, I wondered if those data could confirm this conclusion. Table B08101 reports means of transportation to work by age classes. I downloaded this table for the usual states, counties, cities, and urban areas for every year from 2005 through 2017. It turns out that, if I squint at the data the right way, it seems to support Teralytics’ conclusion. But when I take a broader view, it isn’t quite so certain. Continue reading