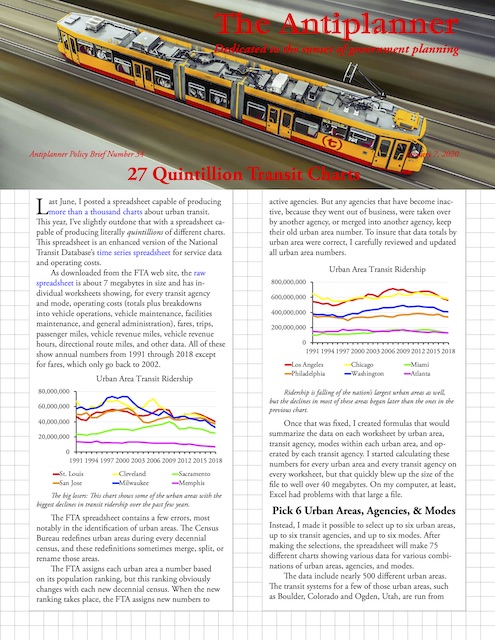
Last June, I posted a spreadsheet capable of producing more than a thousand charts about urban transit. This year, I’ve slightly outdone that with a spreadsheet capable of producing literally quintillions of different charts. This spreadsheet is an enhanced version of the National Transit Database’s time series spreadsheet for service data and operating costs.
 Click image to download a four-page PDF of this policy brief.
As downloaded from the FTA web site, the raw spreadsheet is about 7 megabytes in size and has individual worksheets showing, for every transit agency and mode, operating costs (totals plus breakdowns into vehicle operations, vehicle maintenance, facilities maintenance, and general administration), fares, trips, passenger miles, vehicle revenue miles, vehicle revenue hours, directional route miles, and other data. All of these show annual numbers from 1991 through 2018 except for fares, which only go back to 2002. Continue reading


