Silicon Valley Housing Plan

In December, I pointed out that Silicon Valley’s transit system was designed for the 1910s and suggested a way to redesign it so that it would serve a 2020s urban area. Last month, the Santa Clara Valley Transportation Authority (VTA) announced that is attempting the exact opposite strategy: it wants to turn Silicon Valley into a 1910s urban area.

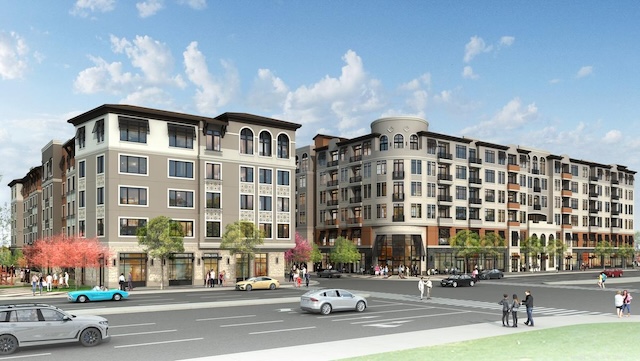
Planned high-density developments aim to turn San Jose into a Greenwich Village lookalike. Source: Republic Urban Properties.

Last week, a Silicon Valley group called Opportunity Now published my assessment of why this strategy is bound to fail. Instead, it will waste a lot of tax dollars and enrich a few property developers without making the region’s housing more affordable or helping regional mobility.

Transit Carries 74% of 2019 Riders in January

Driving and flying have been hovering around 100 percent of pre-pandemic levels for the last year and Amtrak has been around 100 percent for the last six months, but transit is still stuck at just below 75 percent, according to monthly data released by the Federal Transit Administration yesterday. Transit first reached 73 percent last March and 74 percent in September, and even exceeded 75 percent in November (a month that had more business days in 2023 than 2019), but it doesn’t look like it will get significantly above 75 percent for a long time.

When measured as a percent of pre-pandemic travel, transit continues to lag well behind all other modes of travel. Highway data for January 2024 should be available soon. For more on Amtrak and air travel, see yesterday’s post.

The results vary by urban area, of course. Above-average areas include New York (80.5%), Miami (90.5%), Washington (80.6%), San Diego (80.6%), Tampa-St. Petersburg (83.4%), Las Vegas (83.6%), Cincinnati (96.7%), Austin (82.8%), and Richmond (113.1%). Remaining well below average are Chicago (62.6%), Atlanta (53.0%), Boston (62.0%), Detroit (54.7%), Phoenix (50.4%), San Francisco-Oakland (59.0%), St. Louis (58.6%), Pittsburgh (54.5%), and Jacksonville (56.9%). Continue reading

January Air Travel 109.6% of 2019

The airlines carried nearly 10 percent more travelers in January 2024 than in the same month of 2019, according to checkpoint counts made by the Transportation Security Administration. Meanwhile, Amtrak carried 98.2 percent as many passenger-miles in January as in 2019, according to its monthly performance report released early this week.

Transit and highway data for January 2024 should be available soon.

Don’t let the closeness of the airline and Amtrak lines fool you. Airline passenger-miles are not yet available for December and January, but in the 12 months ending in November 2023, the airlines carried 128 times as many passenger-miles as Amtrak. And that’s just counting domestic air travel; when international travel is counted, airlines carried 232 times as many passenger-miles as Amtrak. Continue reading

Transit Use Shrinks to Insignificance

Transit in 2022 carried less than 1 percent of passenger travel in 461 out of the nation’s 487 urban areas and less than half a percent of passenger travel in 426 of those urban areas. It carried more than 2 percent in only 7 urban areas and more than 3 percent in just two: New York and San Francisco-Oakland. These numbers are calculated from the 2022 National Transit Database released last October and the 2022 Highway Statistics released last month, specifically table HM-72, which has driving data by urban area.

Highways were a little less congested in 2022 than before the pandemic. Oregon Department of Transportation photo.

In 2019, transit carried 11.6 percent of motorized passenger travel in the New York urban area, a share that fell to 8.5 percent in 2022. Transit carried 6.8 percent in the San Francisco-Oakland area in 2019, which fell to 3.6 percent in 2022. Transit carried around 3.5 percent in Chicago, Honolulu, Seattle, and Washington urban areas, which fell to 2.5 percent in Honolulu, 2.1 percent in Seattle, and less than 1.8 percent in Chicago and Washington in 2022. Anchorage, Ithaca, and State College PA are the only other urban areas where transit carried more than 2 percent of travel in 2022. Continue reading