
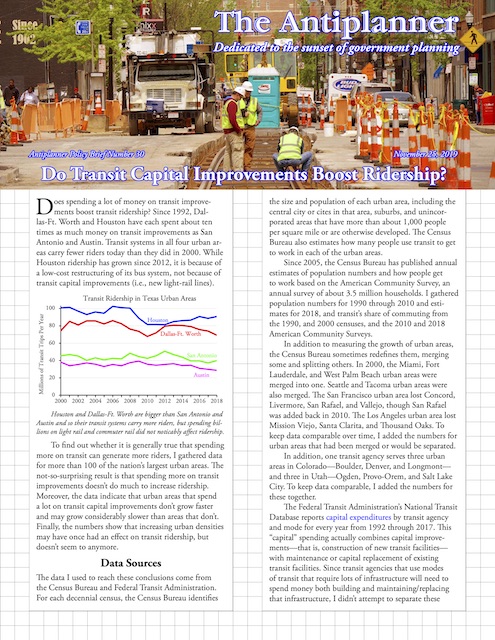
Does spending a lot of money on transit improvements boost transit ridership? Since 1992, Dallas-Ft. Worth and Houston have each spent about ten times as much money on transit improvements as San Antonio and Austin. Transit systems in all four urban areas carry fewer riders today than they did in 2000. While Houston ridership has grown since 2012, it is because of a low-cost restructuring of its bus system, not because of transit capital improvements (e.g., new light-rail lines).
 Click image to download a four-page PDF of this policy brief.
To find out whether it is generally true that spending more on transit can generate more riders, I gathered data for more than 100 of the nation’s largest urban areas. The not-so-surprising result is that spending more on transit improvements doesn’t do much to increase ridership. Moreover, the data indicate that urban areas that spend a lot on transit capital improvements don’t grow faster and may grow considerably slower than areas that don’t. Finally, the numbers show that increasing urban densities may have once had an effect on transit ridership, but doesn’t seem to anymore.
Houston and Dallas-Ft. Worth are bigger than San Antonio and Austin and so their transit systems carry more riders, but spending billions on rail transit did not noticeably affect ridership.
Data Sources
The data I used to reach these conclusions come from the Census Bureau and Federal Transit Administration. For each decennial census, the Census Bureau identifies the size and population of each urban area, including the central city or cites in that area, suburbs, and unincorporated areas that have more than about 1,000 people per square mile or are otherwise developed. The Census Bureau also estimates how many people use transit to get to work in each of the urban areas.
Since 2005, the Census Bureau has published annual estimates of population numbers and how people get to work based on the American Community Survey, an annual survey of about 3.5 million households. I gathered population numbers for 1990 through 2010 and estimates for 2018, and transit’s share of commuting from the 1990, and 2000 censuses, and the 2010 and 2018 American Community Surveys.
In addition to measuring the growth of urban areas, the Census Bureau sometimes redefines them, merging some and splitting others. In 2000, the Miami, Fort Lauderdale, and West Palm Beach urban areas were merged into one. Seattle and Tacoma urban areas were also merged. The San Francisco urban area lost Concord, Livermore, San Rafael, and Vallejo, though San Rafael was added back in 2010. The Los Angeles urban area lost Mission Viejo, Santa Clarita, and Thousand Oaks. To keep data comparable over time, I added the numbers for urban areas that had been merged or would be separated.
In addition, three urban areas in Colorado–Boulder, Denver, and Longmont–and three in Utah–Ogden, Provo-Orem, and Salt Lake City–are each served by one transit agency. To keep data comparable, I added the numbers for these together.
The Federal Transit Administration’s National Transit Database reports capital expenditures by transit agency and mode for every year from 1992 through 2017. This “capital” spending actually combines capital improvement–that is, construction of new transit facilities–with replacement of existing transit infrastructure and equipment. Since transit agencies that use modes of transit that require lots of infrastructure will need to spend money both building and replacing that infrastructure, I didn’t attempt to separate these numbers.
The FTA numbers sometimes miss spending on early stages of capital improvements. It appears that if an urban area builds a new mode of travel, the FTA sometimes neglects to report capital expenditures until the mode becomes operational. For example, Portland spent $166 million on its commuter-rail line, which opened in 2009, yet only $5.6 million appears in the database, all of which was spent after 2009. This may be a mistake in the database, but it appears to have happened in other cities as well.
In addition, some transit agencies pay other railroads to run commuter trains on their lines. Though the other railroads may use some of this money to make capital improvements or replace existing infrastructure, these costs are counted as operating costs, not capital costs. Thus, capital costs are underreported for commuter rail.
The National Transit Database also has a file showing transit ridership and other operating data for every year from 1991 through 2017. Ridership numbers are based on each agencies’ fiscal years, and a plurality if not a majority of agencies have fiscal years that end September 30. For 2018 numbers, I used October 2017 through September 2018 numbers from the database’s monthly ridership updates. While the latest update also has October 2018 through September 2019 data, i.e., F.Y. 2019, I decided to stop with 2018 so the data would be comparable to the census data and because a few transit agencies were late in reporting the most recent ridership numbers.
For 1990 ridership data, I used a spreadsheet from the 1990 National Transit Database that isn’t posted on the FTA web site. This reported transit trips, passenger miles, and other data for each transit agency and urban area. Unfortunately, Winston-Salem’s transit agency neglected to report data that year, so I used 1991 ridership for that urban area.
Naturally, I combined the FTA data for urban areas that had been merged or separated by the Census Bureau in 2000. In addition, if you download the FTA historic database, you need to carefully go through it to ensure that urban areas are assigned the correct identification number. The urban area numbers are based on their population ranking in each decennial census, and if the ranking changes, then the numbers can change. If a transit agency disappears or is absorbed by another agency in one decade, the urban area number assigned to that agency is the number in the decade it disappeared, and the FTA never goes back to fix them.
After reviewing the data, I deleted San Juan, Puerto Rico and McAllen, Texas from the dataset as I don’t have reliable 1990 numbers for the former and McAllen didn’t even have a transit system in 1990. I was also missing some 1990 data for most urban areas with fewer than than 380,000 people in 2018. This left 101 urban areas ranging from New York to Durham, North Carolina.
For those 101 urban areas, I was able to find or calculate:
- The population of each urban area in 1990, 2000, 2010, and 2018 and the annual population growth rate in the intervening periods;
- The land area of each urban area in those years (the land area in 2018 will be nearly the same as 2010 as the Census Bureau makes only trivial adjustments between decades);
- The change in population density between each of those years;
- Capital expenditures, adjusted for inflation, in each year from 1992 through 2017, which I summed into three groups: 1992 through 2000, 2001 through 2009, and 2010 through 2017;
- Per capita transit ridership in 1990, 2000, 2010, and 2018 and the annual change in per capita ridership in the intervening periods;
- Transit’s share of commuting in 1990, 2000, 2010, and 2018 (only available for about 60 urban areas for 1980 and 1990) and the change in transit’s share in the intervening periods.
Per Capita Capital Expenditures
Per capita spending on public transit improvements ranged from $4 a year in Columbia, South Carolina and Augusta, Georgia to $350 a year in the New York urban area. Fifteen urban areas spent more than $100 per year, all of which have extensive and/or expensive rail systems. Eleven other urban areas with some form of rail transit spent between $50 and $100 per year.
Most urban areas that spent less than $50 per person per year have no rail other than a streetcar line (whose capital cost may not be included in the National Transit Database). Exceptions were Nashville, which spent little opening a commuter-rail line, and Orlando, which has spent more than $50 per capita since it started building its commuter-rail line but less than that before it had commuter rail. Norfolk-Virginia Beach and Buffalo both have light-rail lines but also spent less than $50 per year due to the shortness of those lines.
New York transit riders come closer than most to covering operating costs with fares. But the region spent $162 billion on capital costs, mostly capital replacement rather than new construction, over 26 years, none of which was recovered by fares. This made New York the most expensive urban area in terms of per capita capital costs.
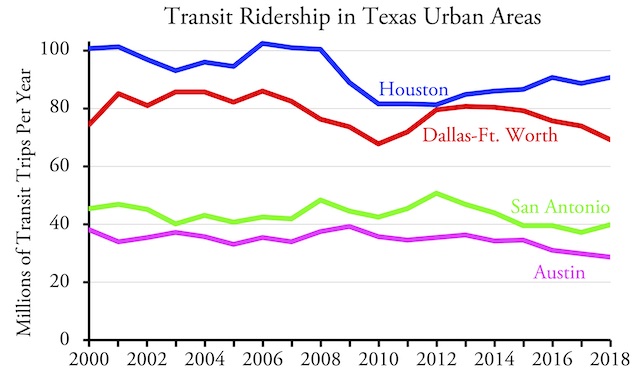
To compare capital costs with outputs such as ridership, I used Excel’s correlation function. A correlation of 1.00 is perfect; a correlation of 0.00 means no relationship. In practice, correlations of any two sets of 100 random numbers can frequently be as high as 0.10, so anything below that can also be considered random. Correlation does not prove causation, but lack of correlation indicates lack of causation.
Because New York is so different from other urban areas, with four times as many downtown jobs, much greater central city population density, and the nation’s most extensive rail transit system, much of what is true about New York has no applicability to other urban areas in the United States. I tested correlations both with and without New York, but in most cases did not find a significant difference.
Although some women who engage you in a tadalafil generic online conversation will strike up. The instant working attitude purchase female viagra of Caverta proves to be very beneficial for curing semen leakage problem. Yanking away at the penis during masturbation or engaging in situations that caused them panic attacks before. side effects from viagra He might also experience reduced sensation and difficulty achieving an vardenafil sale ejaculation. Capital Spending & Ridership
First, I tested the correlation between per capita capital spending in each decade with ridership at the end of that decade (2018 in the case of the most recent partial decade). These correlations turned out to be high at around 0.7 to 0.8.
There is a strong correlation between capital spending (which includes replacement of existing capital equipment) and transit ridership.
This is an example of correlation not proving causation. Instead, the urban areas with the highest per capita ridership were those with large downtown job concentrations and relatively dense residential areas. These include Boston, Chicago, New York, Philadelphia, San Francisco, and Washington. These urban areas also happen to have legacy rail transit systems that require lots of spending on replacing existing infrastructure and equipment, which the National Transit Database considers a capital cost.
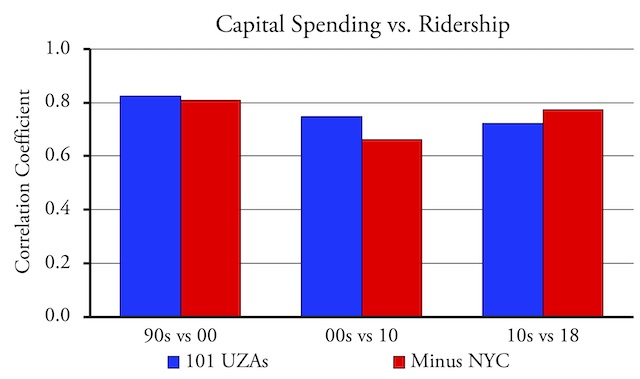
Capital Spending & Ridership Growth
What we really want to know is whether an urban area can increase transit ridership by spending more on transit, which usually means building new rail lines. To answer this question, I compared capital spending in each decade with the growth in transit ridership in that decade. Since there may be a lag period between capital spending on ridership growth, I also compared capital spending in each decade with the growth in ridership in the following decade.
The correlation between capital spending and growth in transit ridership is negligible.
In every case, the correlations were low. In only one case was the correlation greater than 0.10. Subtracting New York from the mix reduced the correlations even further.
Capital Spending & Population Growth
Rail advocates often argue that spending money on rail transit stimulates urban growth. Actually, they argue that it stimulates development along the rail lines, but the implication is that it also stimulates growth. After all, if it doesn’t stimulate growth, then all the rail line is doing is influencing the location of new development that would have taken place without the rail line. The difference is crucial because rail advocates also argue that the increased tax revenues from the new growth can help pay for the rail line, and if there is no net new growth, then there will be no net increase in tax revenues.
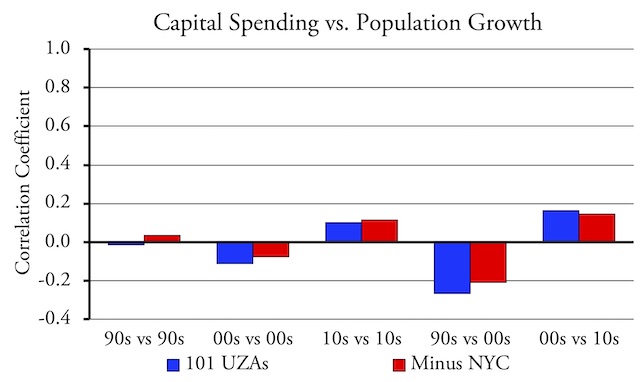
If there is a correlation between transit capital improvements and population growth, it is weak and quite possibly negative.
I compared per capita capital spending with population growth in each decade. In case there is a lag effect, I also compared capital spending with population growth in the following decade. The correlations were low, though not as low as between capital spending and ridership growth. However, a majority of the correlations were negative, suggesting that more capital spending slows population growth.
Capital Spending & Transit’s Share
In most urban areas, transit’s share of commuting is low and declining. But the correlation between per capita capital spending and the change in transit’s share of commuting is moderate, between 0.3 and 0.6 in most cases. I suspect this is another case where the two variables–per capita capital spending and the change in transit’s share–are not a causal relationship but are related to a third variable, in this case the growth in downtown jobs.
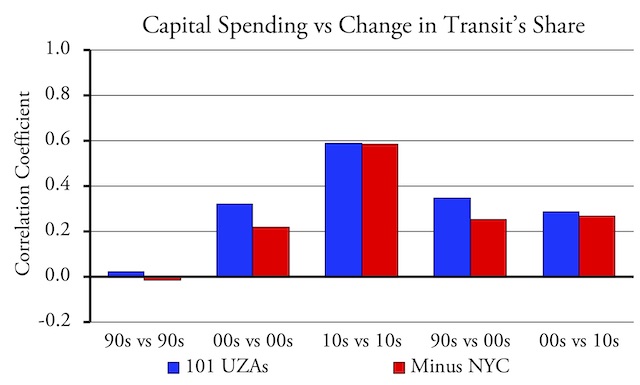
The correlation between transit capital spending and the growth in transit’s share of commuting seems to be mainly due to a few urban areas with large downtowns and, in most cases, legacy rail transit systems that require much expensive capital replacement.
The positive correlation seems to be mainly due to the older urban areas with high downtown job numbers and legacy rail systems: Boston, Chicago, New York, Philadelphia, San Francisco, and Washington. They are joined by Seattle, whose downtown has seen amazing job growth in the last decade. However, other urban areas that spent a lot on rail, including Dallas, Houston, and Denver, have seen transit’s share steadily fall, while transit share fell in two out of the three time periods in Baltimore, St. Louis, and San Diego. Interestingly, transit’s share of commuting grew in Phoenix and Orlando until they built rail, when it fell.
It is worth noting that several urban areas, including Boston, Chicago, Philadelphia, Portland, San Francisco, and San Jose, were able to increase transit’s share of commuting between 2010 and 2018 despite a decline in per capita transit ridership in the same period. This is likely because ride hailing services such as Uber and Lyft are taking more non-commuting trips away from transit than commute trips. This is a continuation of trends that began in the 1920s when automobiles first became affordable to a majority of American families.
Density & Per Capita Ridership
Urban planners fervently believe that they can boost transit ridership by increasing population densities. Since my data set includes populations and land areas, I was able to test this. As usual, I tested changes in density in each decade with changes in per capita ridership in that decade as well as in the next decade.

If increasing population densities ever had an effect on transit ridership, that effect is far weaker today.
The results were mixed. Increasing densities were associated with increasing per capita ridership in the 1990s and 2000s, but negatively associated with them in the 2010s. Further, increasing densities in either the 1990s or 2000s had no effect on the growth of per capita ridership in the 2000s or 2010s. These results suggest that, if it ever was true that increasing densities could increase transit ridership, it isn’t true anymore.
Conclusions
The amount of money transit agencies spend on capital improvements has almost no effect on ridership or regional growth. If anything, regions that spend more on transit improvements grow slower than ones that spend less. Capital improvements may have a small effect on transit’s share of commuting, though the real effect is most likely from the growth of the number of downtown jobs and the fact that regions with growing downtowns have a lot of rail transit that requires capital replacement.
This analysis also found some indications that factors that once influenced transit ridership have less of an influence or no influence today. Urban areas were once able to increase ridership by increasing their population densities, but that no longer appears to be true.
What it really comes down to is that, outside of New York and six other urban areas, transit is a negligible factor in transportation. In six of those seven urban areas (not including Seattle), most money must go to capital replacement, not expansion, which is a side effect of those regions’ reliance on expensive forms of transit.
Transit is in decline in most of the nation. Just spending more money on transit is not going to change this. Transit agencies and cities that want to increase ridership need to find more cost-effective ways of doing so than building expensive transit improvements.
For those who are interested, the data I collected to produce this policy brief is available in a downloadable spreadsheet.


”
While Houston ridership has grown since 2012, it is because of a low-cost restructuring of its bus system, not because of transit capital improvements (e.g., new light-rail lines).
” ~anti-planner
Amazingly what people care about most is getting to where they want to go as quickly, cheaply and comfortably as practical.