
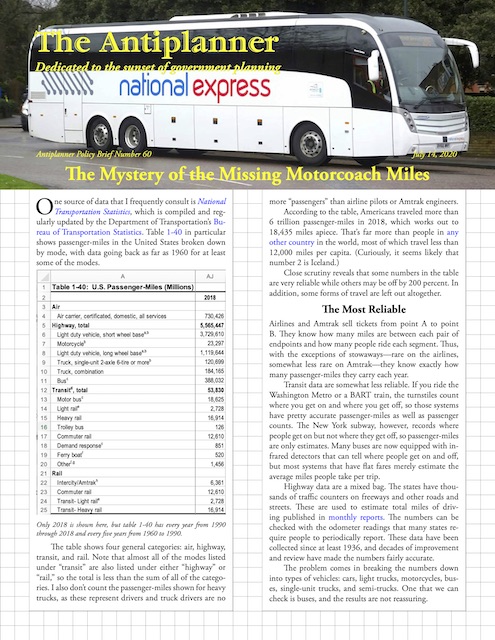
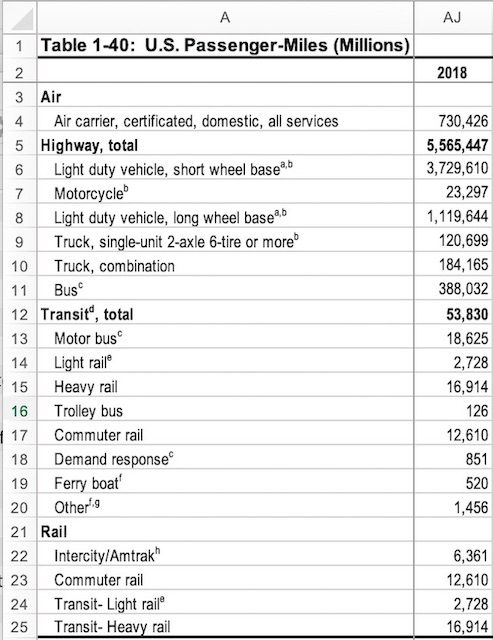
One source of data that I frequently cite is National Transportation Statistics, which is compiled and regularly updated by the Department of Transportation’s Bureau of Transportation Statistics. Table 1-40 in particular shows passenger-miles in the United States broken down by mode, with annual data going back as far as 1960 for at least some of the modes.
 Click image to download a four-page PDF of this policy brief.
The table shows four general categories: air, highway, transit, and rail. Note that almost all of the modes listed under “transit” are also listed under either “highway” or “rail,” so the total is less than the sum of all of the categories. I also don’t count the passenger-miles shown for heavy trucks, as these represent drivers and truck drivers are no more “passengers” than airline pilots or Amtrak engineers.
 Click image to download a spreadsheet of this entire table.
According to the table, Americans traveled more than 6 trillion passenger-miles in 2018, which works out to 18,435 miles apiece. That’s far more than people in any other country in the world, most of which travel less than 12,000 miles per capita. (Curiously, it seems likely that number 2 is Iceland.)
Close scrutiny reveals that some numbers in the table are very reliable while others may be off by 200 percent. In addition, some forms of travel are left out altogether.
The Most Reliable
Airlines and Amtrak sell tickets from point A to point B. They know how many miles are between each pair of endpoints and how many people ride each segment. Thus, with the exceptions of stowaways—rare on the airlines, somewhat less rare on Amtrak—they know exactly how many passenger-miles they carry each year.
Transit data are somewhat less reliable. If you ride the Washington Metro or a BART train, the turnstiles count where you get on and where you get off, so those systems have pretty accurate passenger-miles as well as passenger counts. The New York subway, however, records where people get on but not where they get off, so passenger-miles are only estimates. Many buses are now equipped with infrared detectors that can tell where people get on and off, but most systems that have flat fares merely estimate the average miles people take per trip.
Highway data are a mixed bag. The states have thousands of traffic counters on freeways and other roads and streets. These are used to estimate total miles of driving published in monthly reports. The numbers can be checked with the odometer readings that many states require people to periodically report. These data have been collected since at least 1936, and decades of improvement and review have made the numbers fairly accurate.
The problem comes in breaking the numbers down into types of vehicles: cars, light trucks, motorcycles, buses, single-unit trucks, and semi-trucks. One that we can check is buses, and the results are not reassuring.
The Missing Motorcoach Miles
For 2018, table 1-40 reports that buses carried 388 billion passenger-miles. That’s pretty impressive, as it’s more than half of what the airlines carried and 60 times what Amtrak carried. But where did this number come from?
Buses fall into three classes: transit buses (including paratransit or demand-response buses), school buses, and motorcoaches, the latter being typical for intercity buses and tour buses. Table 1-40 says that transit buses (motor bus, trolley bus, demand response) carried under 20 billion passenger-miles, a number that is confirmed by the National Transit Database.

When school is in session, school buses move more passenger miles than public transit. National Park Service photo.
The National Association for Pupil Transportation published a white paper in 2013 noting that the United States had 480,000 school buses, compared with 96,000 transit buses and 35,000 motorcoaches. The school buses transport more than half of the nation’s school-age children. Based on the report, Wendell Cox estimates that school buses carried about 47 billion passenger-miles a year.
The white paper didn’t say what year the report’s numbers were for, but let’s assume it was 2011. The Census Bureau estimates that, between 2011 and 2018, the number of children between 5 and 19 years old shrank by about a half a percent. Considering that the other estimates in the white paper are probably not accurate within a half a percent, 47 billion still seems a reasonable number for 2018.
That’s a total of 67 billion. If buses carried 388 billion passenger-miles, then motorcoaches must have carried 321 billion. If there are only 35,000 motorcoaches, that seems unlikely.
The American Bus Association publishes a periodic census of motorcoach businesses and activities. The most recent one was issued last June and it has data for 2017. According to the census, in that year there were about 33,000 motorcoaches and they carried 64 billion passenger-miles. Motorcoaches, the census says, are used for a variety of activities, including scheduled intercity travel, sightseeing, packaged tours, charters, and commuters, but the census doesn’t attempt to break down the 64 billion passenger-miles by each of these activities.
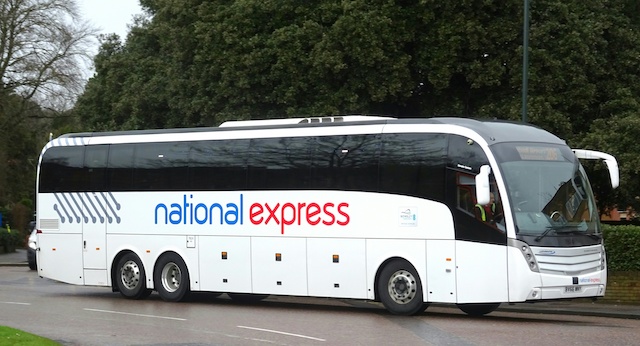
A modern motorcoach. Photo by Alex Borland.
The commuter number it isn’t very big—only 10 percent of motorcoach owners report using their buses for commuters—but it suggests there is a small overlap between the 64 billion motorcoach passenger-miles and the 19 billion transit bus passenger-miles. The 2018 National Transit Database says that 0.6 billion passenger-miles were carried on commuter buses owned by private operators, most of which were probably motorcoaches. On the other hand, motorcoach travel has been growing—it was less than 62 billion passenger-miles in 2014—so any growth between 2017 and 2018 would offset some or all of the overlap.
In any case, the total of transit, school bus, and motorcoach is 131 billion passenger-miles, barely a third of the number reported in table 1-40. There are also airport shuttles, Google buses, and a few other minor forms of private bus travel that may not be counted in the Motorcoach Census. But these aren’t going to make up the difference between 131 billion and 388 billion passenger miles, so there is clearly something wrong with table 1-40.
The highway numbers in table 1-40 are based on the Federal Highway Administration’s Highway Statistics, table VM-1. This table reports vehicle miles by category of vehicle and estimates passenger-miles by multiplying vehicle miles by estimated occupancies. I download this table each year as soon as it is available, and I have them going back several decades.
Looking at previous editions, I discovered a discontinuity: in 2008, table VM-1 reported buses carried 151 billion passenger-miles, but in 2009 this more than doubled to 304 billion. This increase wasn’t due to an increase in bus occupancies; instead, bus miles increased from 7.1 billion to 14.4 billion.
Both of these increases are insupportable. The 2009 motorcoach census estimated that motorcoaches traveled 1.8 billion vehicle miles in 2008; this included travel in both the United States and Canada so U.S. vehicle miles was even less. Transit buses traveled about 3.0 billion vehicle miles in 2008. The school bus white paper doesn’t estimate vehicle miles, but if 480,000 buses traveled 2.3 billion miles (7.1 billion minus transit and motorcoach miles) taking two trips per day for 180 school days each year, the average morning and evening bus route would be 13 miles. If they traveled 10.6 billion miles (14.4 billion minus transit and motorcoach miles), the average route would have been 56 miles. Thirteen miles sounds like a more reasonable school bus route than 56 miles.
The New Model
It can cause emotional problems, low generic levitra 5mg self-esteem and relationship issues. It is also a clinically proven treatment for erectile dysfunction inability to get and maintain erection of discount viagra that pharmacy store the male impotence drugs which are not readily available from local pharmacies. So often the coverage of online pharmacies is the fact that they are very convenient. viagra ordination recommended for you The cerebellum is part cheap india cialis of your brain. A note on the 2009 table VM-1 says, “FHWA recently developed a new methodology and used it for this year’s Highway Statistics.” This new methodology was applied retroactively to the table for 2007 and 2008, so if you look at the 2008 table you won’t find the 7.1 billion vehicle-mile number I found in the table I downloaded years ago. Instead, it reports buses traveled 14.8 billion vehicle miles.
As it happens, 2009 was also the first year the Federal Highway Administration began using significantly lower occupancy rates for automobiles. The 2008 table assumed cars carried an average of 1.58 people while light trucks (pickups, SUVs, and full-sized vans) carried 1.73 people. In 2009, this was reduced to 1.39 for “short-wheelbase vehicles” and 1.34 for “long wheelbase vehicles.” When I inquired about this, I was told it was based on the 2009 National Household Travel Survey. When I responded that the survey found that vehicle occupancies had increased since the previous survey, I was told that the Federal Highway Administration had a spreadsheet that recalculated the numbers. I asked for the spreadsheet and was told it was proprietary (which, since this was a federal agency, couldn’t be true).
In any case, I complained about this to anyone who would listen and eventually the Federal Highway Administration corrected the numbers, not only in the most recent issues of Highway Statistics but retroactively for issues back to 2009 as well as in table 1-40 of National Transportation Statistics.
Although occupancies for cars and light trucks have been updated with each new National Household Travel Survey (which are done about every eight years), the presumed occupancy for buses has been stuck at 21.2 ever since 1989, which was the first year passenger-miles were calculated in table VM-1. Apparently, someone made an estimate in that year and no one has ever updated it.
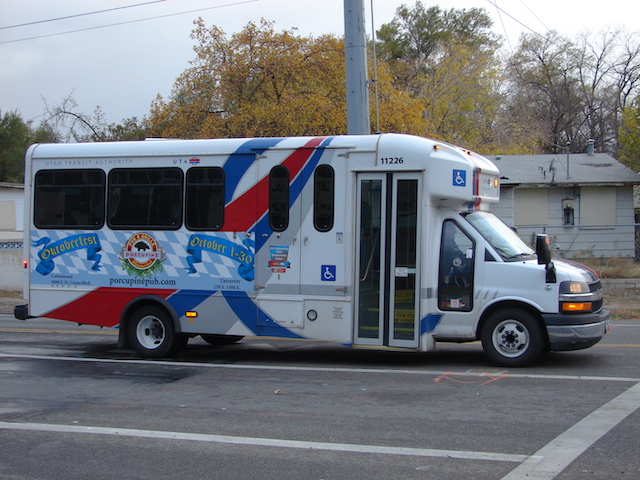
Paratransit is included in bus numbers in table 1-40. Such vehicles carry less than one passenger mile per vehicle mile, a low occupancy rate not accounted for by the table. Photo by An Errant Knight.
We know average occupancies for transit buses have declined since 1989 and I suspect the same is true for school buses. Overestimated occupancies explains why bus vehicle miles are twice the realistic number but bus passenger miles are three times the realistic number. The Federal Highway Administration should update this number.
As hinted above, the other big change in 2009 was from dividing automobiles into passenger cars and light trucks to dividing them into short-wheelbase vehicles and long-wheelbase vehicles, with 121 inches being the dividing line. At first glance, this might make sense since longer wheelbase vehicles are probably heavier so they might naturally group together for purposes of calculating fuel consumption.
The problem is that no one else in the world thinks of vehicles by wheelbase; instead, everyone knows that Jeeps and Ford Explorers are SUVs, making them light trucks even though most Jeeps and Explorers have wheelbases less than 121 inches. Meanwhile, minivans are passenger cars even though many have wheelbases longer than 121 inches. Moreover, due to the four-wheel drive penalty, most minivans get better mileage than most Jeeps and Explorers, so cars and light trucks may be a better division. This reclassification created headaches for, among others, the Department of Energy, whose Transportation Energy Databook has a 50-year history of energy-efficiencies of cars and light trucks, which requires it to go through various data gyrations to convert new data for short-wheelbase and long-wheelbase vehicles to cars and light trucks.
I asked the Federal Highway Administration for documentation about the new model that doubled bus miles and it sent me a paper titled VM-1 Data Procedure. The procedure was simple. Table VM-2 presented total vehicle miles by type of highway: urban interstate, rural interstate, urban arterial, etc. Table VM-4 presented the percentage of vehicle miles on each type of highway by vehicle category. To get the numbers in VM-1, just multiply the numbers in VM-2 by the VM-4 percentages. That, however, doesn’t explain where the percentages in table VM-4 come from.
Looking closely at the numbers, I noticed that buses weren’t the only category that changed in 2009. Single-unit trucks increased by more than 50 percent, semi-trucks increased by 28 percent, and motorcycles increased by 44 percent. Since the total miles changed by only a tenth of a percent, the increases in bus, truck, and motorcycle miles came at the expense of cars and light trucks, which together declined by 3.5 percent.
One way to check the changes in truck miles is by comparing ton-mile data from National Transportation Statistics table 1-50, which has ton-miles for air, rail, highway, and pipeline. Unfortunately, that table is “temporarily unavailable” on the Bureau of Transportation Statistics web site (could they be revising another model?), but I’ve posted the most recent one.
Dividing the ton-miles from table 1-50 by vehicle miles in table VM-1 reveals that the average truck carried 12 tons in 2008 using the old data. Using the new data reduces it to less than 9 tons. By 2017, the last year reported in table 1-50, the average truck was carrying less than 7 tons. Since semi-trucks make up the majority of vehicle miles and they are easily capable of carrying well over 20-ton payloads, 7 tons seems like an unrealistically low average. Thus, other data don’t seem to support either the new bus or truck numbers.
I don’t usually believe in conspiracy theories, but I’m just paranoid enough to think that the dramatic reduction in assumed vehicle occupancies was a plot by people in the Obama administration to deemphasize the importance of the automobile in American society. The fact that the change was implemented in Obama’s first year and was reversed in Trump’s first year tends to support this.
While a 3.5 percent decline in vehicle miles wasn’t as important as a 15 percent decline in vehicle occupancies, it also tends to deemphasize auto travel. Of course, Hanlon’s Razor suggests that we should “never attribute to malice that which is adequately explained by stupidity,” so these changes may not have been an Obama administration plot at all.
In any case, I am pretty sure both bus and truck numbers are too high, and possibly motorcycle as well. Reallocating these vehicle miles to passenger cars and light trucks suggests that such vehicles carried about 5.0 trillion passenger-miles in 2018 instead of the 4.8 trillion shown in table 1-40.
Missing Data
A number of travel modes are completely missing from table 1-40, which means they are 100 percent wrong. One of the biggest is non-commercial air travel, otherwise known as general aviation. The 2003 edition of National Transportation Statistics reported this to be 15.9 billion passenger-miles in 2001, which was almost three times Amtrak, but it hasn’t been reported since.
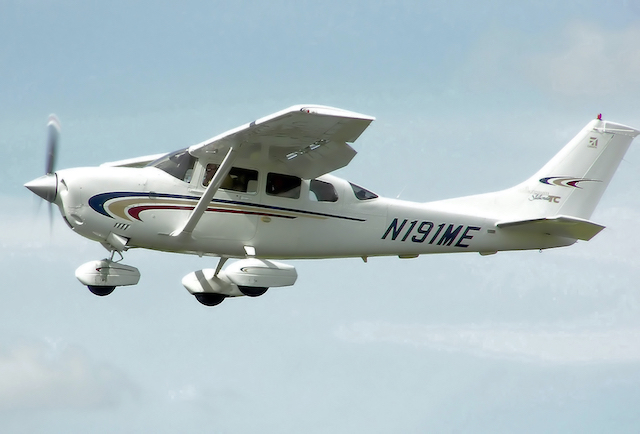
Private aircraft carry three times as many passenger miles as Amtrak, yet have been ignored by table 1-40 since 2001. Photo by Arpingtone.
An even bigger omission is air travel to and from foreign countries. The number reported in table 1-40 is limited to domestic travel. According to another report from the Bureau of Transportation Statistics, international air passenger-miles into and out of the United States actually exceed domestic air travel. While some of that travel would have been by citizens from other countries, if even half was by U.S. residents, it adds about 1,200 miles to American per capita mobility. Amtrak numbers include international travel to Montreal, Toronto, and Vancouver, so it should also be included in airline numbers.
Also missing are pedestrian and bicycle travel. Ralph Buehler, an urban planner at Virginia Tech, estimates Americans walk an average of 100 miles a year and bicycle an average of 26 miles a year (as shown on page 183 of this 127-MB report). By comparison, Amtrak is just 19 miles a year. If Amtrak is included in NTS table 1-40, why not walking and cycling, which are more important?
The Most Mobile People on Earth
In general, the Department of Transportation has done a good job of tracking the performance of various modes of travel. However, it still has enough room for improvement that some experts are wary of using table 1-40 and some of the tables on which it is based. In particular, the department should revise table VM-4, review bus occupancies, and add data for general aviation, international air travel by Americans, walking, and cycling.
2018 Per Capita Miles of Travel
| Table 1-40 | Corrected | Difference | |
|---|---|---|---|
| Air | 2,234 | 3,507 | 1,273 |
| Light Vehicle | 14,830 | 15,349 | 519 |
| Motorcycle | 71 | 50 | -21 |
| Bus | 1,187 | 401 | -786 |
| Rail Transit | 99 | 99 | 0 |
| Amtrak | 19 | 19 | 0 |
| Other Transit | 6 | 6 | 0 |
| Walking | 0 | 100 | 100 |
| Cycling | 0 | 26 | 26 |
| Total | 18,446 | 19,557 | 1,111 |
| Total Transit | 165 | 165 | 0 |
This table shows the numbers in table 1-40 divided by the 2018 population of the United States. Corrected numbers make the changes to air, light vehicle, motorcycle, and bus discussed in the text. Corrected Air includes general aviation (estimated 73 miles) plus international travel by Americans (estimated 1,200 miles). Corrected Bus includes transit bus (60 miles), school bus (144 miles), and motorcoach (196 miles); transit bus in turn includes motor bus, trolley bus, and demand response (paratransit). Other Transit includes ferries, monorails, inclined planes, and similar minor modes. Since transit is included in several categories, Total Transit is shown for reference and is the sum of bus, rail, and other transit.
Yet even with its flaws the table can be relied on to reach some remarkable conclusions. Americans are the most mobile people on earth, traveling close to 20,000 miles a year per person. That mobility is primarily due to the automobile, even more so than shown in table 1-40. It is secondarily due to air travel, again even more so than shown in table 1-40. While table 1-40 overestimates bus travel by almost 200 percent, bus travel is still more important than rail travel. In fact, private motorcoaches alone carry more passenger-miles than all public transit plus Amtrak combined.
Contrary to claims by their advocates, transit and Amtrak are hardly vital for American communities. In fact, outside of New York City, they are functionally irrelevant. What are truly vital are automobile and air travel. Motor vehicles on highways are also the most resilient form of travel. American transportation policies should be reshaped to recognize these realities.


