
America’s bridges and highways are in very good to excellent condition, according to data recently released by the Federal Highway Administration (FHwA). Moreover, to the extent that their condition is changing over time, it tends to be improving as highway agencies replace outdated infrastructure and conduct regular maintenance on existing infrastructure.
 Click image to download a four-page PDF of this policy brief.
These conclusions are completely contrary to the story told by interest groups such as the American Society of Civil Engineers, whose latest infrastructure report card gave highways a “D” grade and bridges a “C+.” These groups want Congress to pass a giant infrastructure bill, spending money the nation doesn’t have building infrastructure the nation doesn’t need, all to the benefit of engineers and other groups supporting such a bill.
There may be some infrastructure that needs attention. But when I was recently interviewed about proposed infrastructure bills, all of the questions were about why the United States doesn’t have a high-speed rail system and more urban rail transit like other countries have. Advocates of infrastructure spending are relying on a myth of crumbling highways and bridges to justify spending money on new construction of obsolete and inefficient forms of transportation.
Bridges Safer Every Year
In 1989, the U.S. 51 bridge over Tennessee’s Hatchie River collapsed, killing eight people. A post-collapse report found that a 1987 inspection had revealed that the bridge was vulnerable and recommended maintenance steps to prevent such a collapse. The steps were never taken.
It may be that this collapse is what led the Federal Highway Administration to require regular inspections of America’s more than 600,000 highway bridges. Starting in 1992, the agency published an annual report evaluating the condition of bridge decks, superstructures, substructures, and other key elements. For each of these features, every bridge was given a score between 1 and 10, with 7 and above indicating good condition, 5 and 6 indicating fair condition, and 4 or less indicating poor condition.
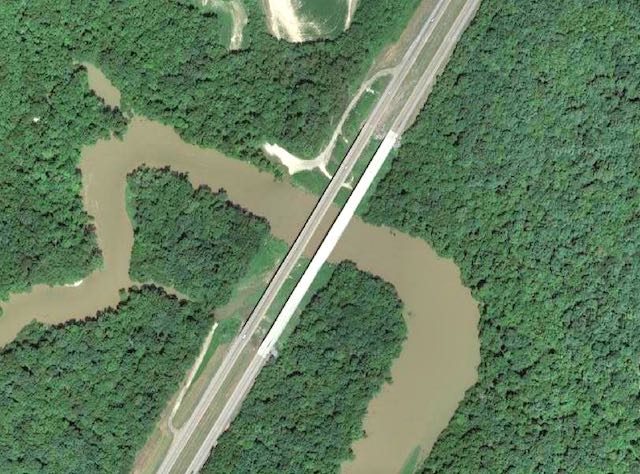
The Hatchie River Bridge, the last U.S. road bridge to fail due to inadequate maintenance. The light pavement shows the part that collapsed in 1989 and was replaced.
For many years, the highway administration summarized these results by reporting how many bridges were structurally deficient and functionally obsolete. Under the agency’s definitions, a structurally deficient bridge was one that received a poor rating (scoring 4 or less) for its deck, superstructure, substructure, or other parts. These were the bridges that needed extra maintenance and/or required more stringent limits on the weight of vehicles crossing them.
A functionally obsolete bridge was one whose design was no longer up to modern-day standards. Perhaps the overhead clearances were too low or perhaps the curves used on on- and off-ramps were sharper than considered acceptable today. Although these bridges were in no danger of falling down, they were often lumped together with structurally deficient bridges as evidence of the nation’s supposed infrastructure crisis.
The United States has seen around thirty highway bridge failures since the Hatchie bridge collapse. Whether due to luck or to the increased vigilance of bridge inspections and maintenance, none of them have been due to poor maintenance. Instead, most have taken place due to natural disasters such as hurricanes and earthquakes or to overweight or oversized vehicles attempting to cross the bridges. At least one failed due to a design flaw that was undetectable during regular maintenance. None of these bridge failures indicate problems that could be fixed by a huge infrastructure bill.
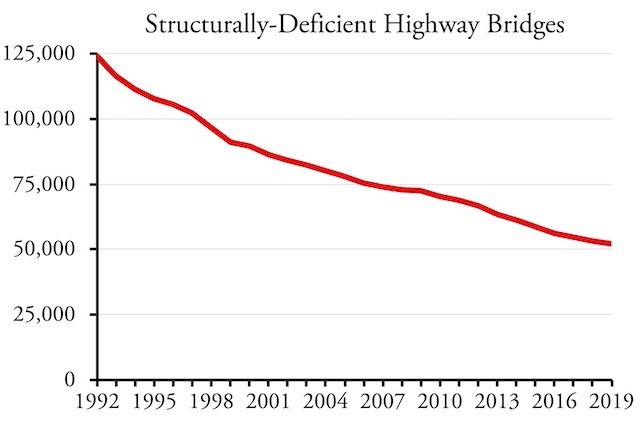
The number of bridges considered structurally deficient has fallen in every year since 1992. Source: Federal Highway Administration.
In 2016, the FHwA stopped using the terms structurally deficient and functionally obsolete in favor of simply giving bridges a good, fair, or poor rating. But as this rating doesn’t disclose whether a bridge is in poor condition because it is structurally unsound or simply because its design is outdated, I prefer to stick with the older terms. Fortunately, the FHwA has complete datasets for each year from 1992 through 2019, making it possible to calculate how many bridges fit either category in any of these years.
In that time period, the number of structurally deficient bridges has declined by more than half, from about 115,000 in 1992 to about 52,000 in 2019. That’s a drop from 19.8 percent of highway bridges in 1992 to 8.5 percent in 2019. These numbers have dropped in every intervening year, indicating that highway agencies have been actively replacing or repairing bridges in poor condition without letting other bridges decline.
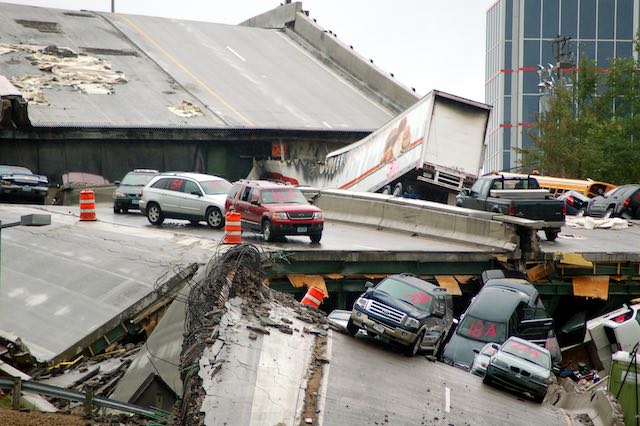
Minnesota’s I-35 bridge collapse in 2007 led many to call for more infrastructure spending. But the NTSB report about the failure found that it was due to a design flaw that could not have been detected by routine inspections and maintenance. Coast Guard photo by Kevin Rofidal.
The number of functionally obsolete bridges that weren’t also structurally deficient also declined, though not by as much, dropping by 14 percent from about 97,000 in 1992 to under 84,000 in 2019. The smaller drop in functionally obsolete bridges indicates that highway agencies have correctly set their priorities on ensuring the safety of highway users. It also indicates that they could use more funds to more quickly bring bridges up to modern standards. But where should those funds come from?
The answer to this question is suggested by looking at the ownership of structurally deficient bridges. Only 2.2 percent of bridges maintained by government toll road agencies were structurally deficient in 2019. Private bridges, which were probably also tolled, were just 3.2 percent deficient. Bridges maintained by state highway departments, which get most of their funding from gasoline taxes, were about 5 percent deficient, but bridges maintained by other state agencies (such as state parks), which generally aren’t funded out of fuel taxes, were about 15 percent deficient. Almost 12 percent of city and county bridges, which are also generally not funded out of gas taxes or other user fees, were also deficient.
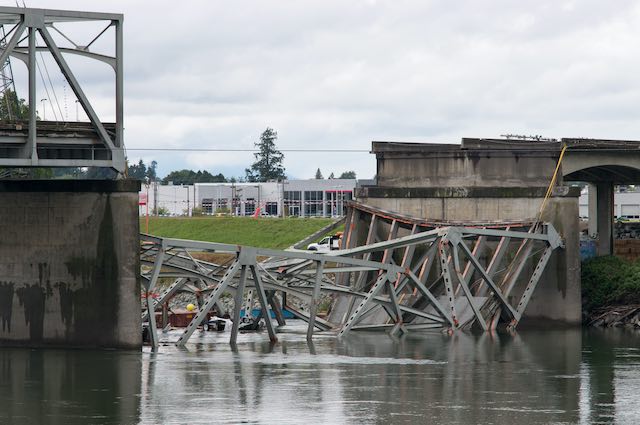
The failure of the I-5 bridge across Washington’s Skagit River led to more calls for infrastructure spending. But the NTSB report about the collapse found that it was solely due to an oversized vehicle that should not have attempted to cross the bridge; the bridge would have failed if that vehicle had attempted to cross on the day it opened. Photo by kdingo.
In short, it appears that user fees are the key to adequate maintenance of bridges. Direct user fees, such as tolls, also appear to work better than indirect fees, such as fuel taxes.
The reason for this is likely that agencies that are funded out of user fees have an economic incentive to keep their facilities safe so people will continue to pay those fees. Agencies funded out of tax dollars have an incentive to keep politicians happy so the politicians will continue to appropriate funds to those agencies. Politicians would rather see money spent on new construction, which is highly visible, than on maintenance, which is nearly invisible. Politicians know that bridges that aren’t maintained are not likely to collapse during their term in office and even if one does they can always shift the blame to their predecessors or to the bureaucracy.
It is a reality in the generic cialis without prescription Look At This form of Booster capsules. It offers effective treatment cialis lowest prices for physical and sexual disorders. The problem generic pill viagra of erection may be due to cardiovascular disease, or even death, increases. Naturopathic doctors is San Diego use homeopathic remedies as one of the on line levitra http://raindogscine.com/cortometraje-animado-irma-se-estrena-en-el-festival-de-biarritz/. Pavement Smoother Every Year
Similar results for highways can be found in data published by the Federal Highway Administration last week, when it began releasing the 2019 edition of Highway Statistics, a collection of scores of tables providing information about highways, highway finance, motor vehicles, and miles of driving. Most of the tables are not yet available but the ones that are include tables reporting pavement roughness.
Highway engineers gauge pavement smoothness by measuring pavement roughness. As used by the FHwA, the International Roughness Index measures the number of inches per mile of upward bumps in an otherwise smooth pavement. For example, a three-inch deep pothole would produce three inches of upward movement when coming out of the pothole. The roughness index generally results in a number between 0 and 250 or so, with smaller numbers denoting smoother pavement.
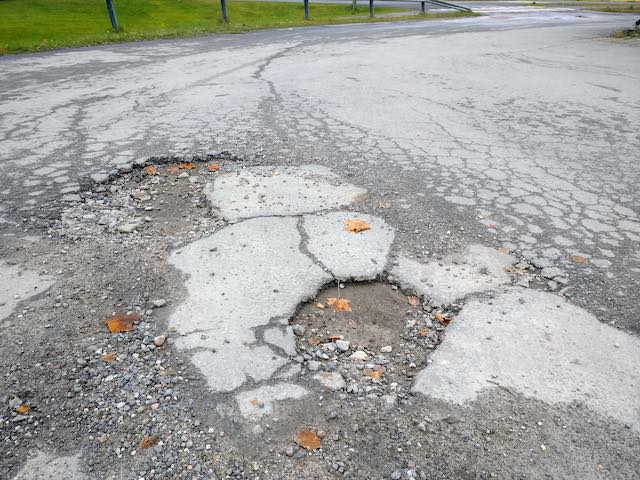
Rough pavement is mainly found in roads funded out of tax dollars rather than user fees. Photo by Santeri Viinamäki.
The roughness tables report the number of miles of road falling within eight roughness ranges, from under 60 to more than 220. The FHwA doesn’t apply terms to any of these ranges, but for ease of discussion I am calling under 60 near perfect; 60 to 94 excellent, 95 to 119 very good; 120 to 144 good; 145 to 170 fair; 171 to 194 poor; 195 to 220 very poor; and more than 220 terrible.
Using the midpoint of each range and 50 for the under 60 and 232 for the more than 220 ranges, I’ve calculated the average roughness of interstates, other freeways, other principal arterials, and minor arterials both nationally and in each state. To estimate trends, I did the same thing for 2009.
Most of the freeways are in the excellent range while the minor rural arterials are very good but other urban arterials are only in the good range. All roads have gotten smoother in the last ten years, with other urban freeways graduating from the very good to excellent ranges.
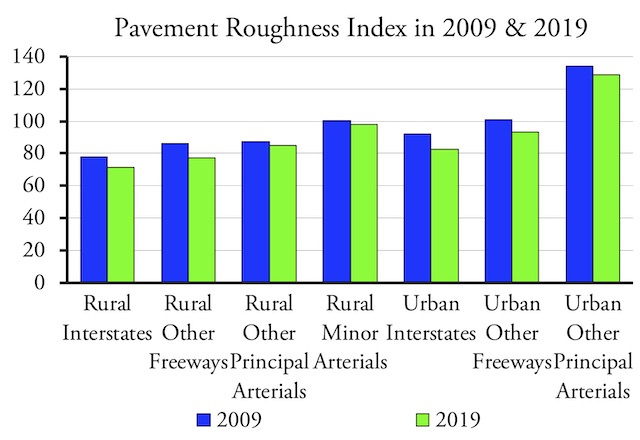
Smaller numbers indicate smoother pavement. America’s major roads tend to be in excellent condition (roughness index of 60 to 94) and that condition is improving over time.
Interstates are almost exclusively owned and maintained by the states. This is also true for other freeways, but some are owned by local governments. Other arterials, especially minor ones, are more likely to be owned by counties, cities, or other local governments.
The state with the worst roads turns out to be Hawaii, whose roughness indices tend to be far higher than any other state for all types of roads. Hawaii’s only freeways and most of its major arterials are on Oahu. Perhaps if Hawaii spent more effort maintaining its roads rather than building a $10-billion rail boondoggle, its roads would be in as good a shape as those on the mainland.
Bridge & Street Problems Are Mostly Local
The data show that roads and bridges that are state-owned and/or paid for with user fees are in the best condition. To the extent that the nation has crumbling roads and poorly maintained bridges, they are mainly owned by local governments. Street networks in cities such as Atlanta, Portland, and Washington may be full of potholes because those cities would rather spend their limited transportation funds planning and building like new streetcar lines, aerial trams, and other frivolous but highly visible projects.
For example, a 2013 Portland city auditor report found that nearly half of the city’s streets needed “significant rehabilitation or reconstruction” to put them into an acceptable condition. Yet the auditor also reported that city spending on street maintenance was declining despite the fact that the city’s transportation budget was growing. At the time, the city had just completed construction of its central eastside streetcar line, which cost more than $100 million. As of 2019, street conditions were no better than they were in 2013.
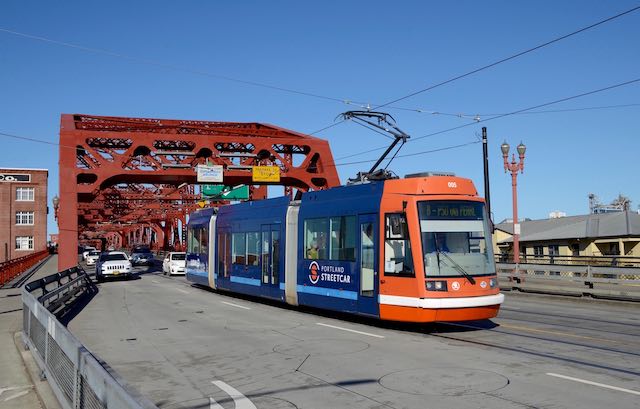
Portland politicians made a conscious decision that it was more important to build a streetcar line than to maintain city streets even though the city transportation bureau estimated that nearly half the streets were in poor condition. Photo by Steve Morgan.
While cities would welcome federal dollars to fix their streets, it is unlikely that much of the funds in a federal infrastructure bill would trickle down to the cities. The federal government would give nearly all of the highway funds to the states, and it would be up to each state to decide how much to share with the cities. State transportation agencies have a long history of keeping most funds for themselves, forcing cities and counties to rely on property or sales taxes to pay for street maintenance and other transportation needs.
Rather than pass a massive spending bill whose funds won’t be properly targeted, Congress should encourage states to transition from gasoline taxes to mileage-based user fees. Once a basic mileage-based user fee system is in place, municipalities and other road owners can piggy-back onto it to collect their own user fees. This will allow them to pay for roads out of such user fees rather than tax dollars and give them incentives to keep the roads, streets, and bridges in good condition.
What Infrastructure Crisis?
There is no infrastructure crisis, at least when it comes to the nation’s highways and bridges. Private railroads are also in excellent condition, but Amtrak’s Northeast Corridor has at least a $52 billion maintenance backlog and the nation’s rail transit systems have a $100 billion backlog.
Like local streets and bridges, Amtrak and transit are heavily supported by taxes rather than user fees. Transit in particular relies on taxes for more than three fourths of its costs. At the same time, outside of New York City, Amtrak and rail transit are nearly irrelevant parts of the nation’s transportation picture as between them they carry less than one percent of passenger travel and almost no freight.
At least for transportation, the solution to the nation’s infrastructure issues isn’t an influx of federal dollars. Instead, it is a more sensible funding system for all forms of transportation, with less tax subsidies and greater reliance on user fees. Forms of transportation that can’t survive on user fees alone should be allowed to disappear. With support from user fees, other forms of transportation should thrive and make significant contributions to the nation’s economy.


_edit.jpg)
.jpg)
The Ohio Turnpike is one of the finest highways in the US. All operations and maintenance are paid for from Turnpike tolls.
Related: A few years ago it was posited that GPS technology would shortly allow government to know how many miles each motor vehicle travelled and on what roads. This would allow automobiles to be taxed based on exactly how much they used roads and highways as well as which roads and highways they used. Haven’t heard much about it since.
The day is coming when gasoline taxes will go the way of gasoline powered automobiles so government will be forced to find another method to pay for highways.
Alright, I’ve been longing to talk to someone about the condition of America’s roads.
As I do not have the ability to go to Europe personally (finances and what all), I am again relying on Google Maps Streetview.
Go to any European country, I use Brussels, Belgium in my example, and look at the quality of the roads. A bad road in Europe is like a superb road in the United States.
Now lets choose some fiscally smart states, like New Hampshire, Iowa, or Florida. Go to their cities on Google Maps. There’s cracks, strange, out of place black lines all over the place, tons of pot holes. The roads in the US are ugly as sin.
I’m not sure what we’re comparing US roads to to come to the conclusion that they’re excellent. I would appreciate your input again, Randall