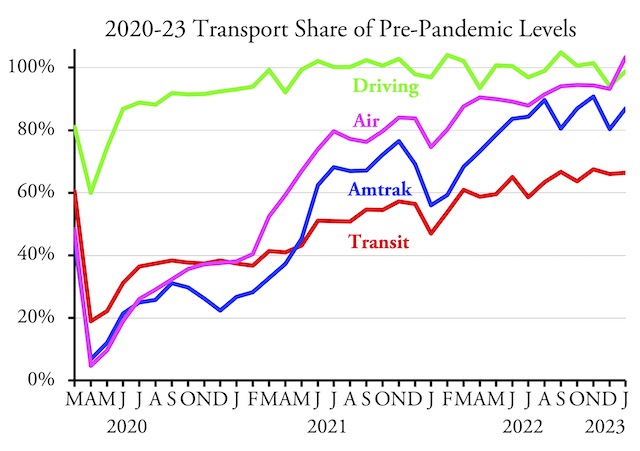
Americans drove 98.9 percent as many miles in January 2023 as they did in the same month of 2019, according to data released by the Federal Highway Administration yesterday. Driving in rural areas averaged 4.6 percent greater than in 2019, while driving in urban areas was about 3.4 percent less.
Amtrak numbers are from the company’s monthly performance report; see this post for a discussion of those numbers. Transit numbers are from the Federal Transit Administration and air travel numbers are from the Transportation Security Administration; see this post for a discussion of those numbers.
January’s urban driving exceeded 2019 miles in 20 states. The biggest gains were in Rhode Island (up 22%), Louisiana (10%), Idaho (8%), New Jersey (8%), Texas (7%), and Pennsylvania (5%). The biggest shortfalls in urban driving were in Michigan (down 16%), Colorado (-16%), Arkansas (-15%), North Dakota (-14%), and Hawaii (-13%).
Americans drive far more miles in urban areas than in rural areas, so changes in rural driving are less important overall. But for some reason rural driving in Rhode Island increased by 70 percent, and it increased by 34 percent in Hawaii and 33 percent in Missouri. January’s rural driving was less than 2019 in only 11 states, with the biggest drop in Massachusetts where it was down by 29 percent.
Some of these numbers result from state-to-state migrations. Idaho and Texas, for example, are among the nation’s fastest-growing states. But Rhode Island’s population fell in 2022, so why has its driving increased by so much while Massachusetts rural driving has fallen so much? Perhaps people who once commuted from homes in Rhode Island to jobs in Massachusetts are now working at home and are driving more local miles in their free time.
Here’s another puzzle. The Federal Highway Administration’s breakdown of urban and rural driving counts only driving on arterial roads, while the total driving numbers include all roads. Presumably, driving on non-arterials parallels arterial driving as people have to take local and collector roads to get to the arterials. But Massachusetts rural arterial driving was down 29 percent and its urban arterial driving was down half a percent, yet its overall driving was up 1.2 percent.
This may reflect the fact that people working at home are likely to increase their overall driving but may do that driving mainly on local and collector roads, not arterials (such as freeways and major expressways). But if the Federal Highway Administration has data on collector roads, why doesn’t it break it down to urban and rural?


