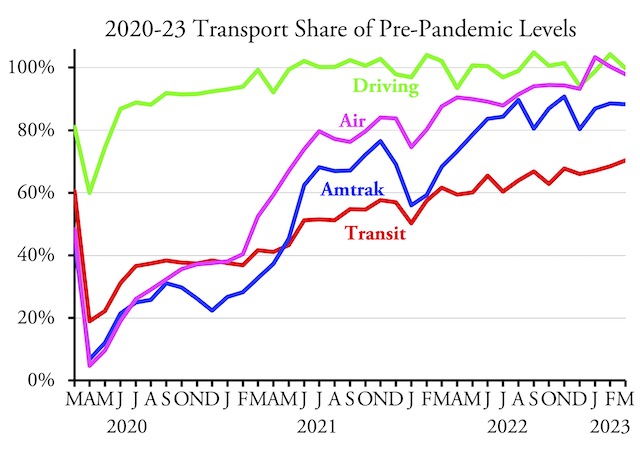
Americans drove 99.9 percent as many miles in March 2023 as in the same month in 2019, according to data released by the Federal Highway Administration on Friday. Rural driving was 4.1 percent greater than in 2019, and driving on urban interstates was 1.5 percent greater, but other urban driving was 3.1 percent less than in 2019, dragging down the overall average.
See May 5 post for discussion of transit, Amtrak, and airline travel.
I have to say I’m a little bit skeptical of these numbers. Throughout the pandemic, rural driving has been a bit ahead of urban, so that makes sense. However, urban interstate driving was generally behind other urban driving. Why is it suddenly ahead now?
The data include three kinds of urban driving: interstates, other arterials, and everything else. The numbers come from traffic counters on arterials (including freeways) and collectors. However, no traffic counters on local roads are used to calculate these numbers, so the agency just estimates. Something tells me they underestimated this time — after all, people have to drive on local roads to get to the interstate freeways. These numbers are preliminary so we may see an update next month.
Driving in Rhode Island and Montana are up 19 percent since 2019; Louisiana is 18 percent; and Alabama, Idaho, and Missouri are also up by more than 10 percent. A total of 26 states plus DC saw more March driving in 2023 than 2019.
West Virginia was 27 percent below 2019; North Dakota –13 percent; New York was –17 percent; California –12 percent; and Vermont –11 percent. Rural driving in California was up 13 percent, but 95 percent of Californians live in urban areas and 87 percent of driving takes place in those areas, so that didn’t have much of an impact on the state total.


