
Rail transit is a waste of money, and what little benefit it provides in the form of congestion relief is far exceeded by its cost. That is the Antiplanner’s general opinion, and it is shared by economists Clifford Winston, of the Brookings Institution, and Vikram Maheshri, of UC Berkeley.
The two have written a paper, On the Social Desirability of Urban Rail Transit Systems, that has been circulating around the Internet for awhile (and was previously mentioned by the Antiplanner). Now it is being published in the Journal of Urban Economics.
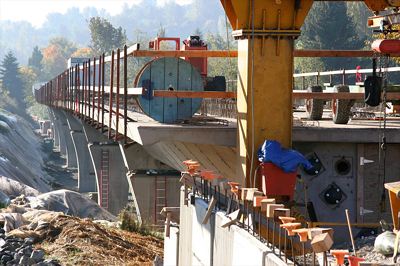
At $170 million, the cost of building each mile of Seattle’s new light-rail line is enough to construct four miles of a four-lane freeway. If Seattle is lucky, its light rail will carry 30 percent of a single freeway lane; the national average is just 25 percent.
Flickr photo by brewbooks.
Winston and Maheshri examine 25 light- and heavy-rail systems in the U.S. and find that, with the exception of the San Francisco BART system, “every system actually reduces welfare and is unable to become socially desirable even with optimal pricing or physical restructuring of its network” (emphasis in original).
Supposedly, we build rail transit to “get people out of their automobiles,” as if that is a worthwhile goal. Whether worthwhile or not, it hasn’t worked. In 1970, when all but eight American cities had converted their rail transit systems to buses, the census found that 3.1 percent of American commuters took rail transit to work. By 2000, after fifteen urban areas had built brand-new rail systems, the census found that only 2.1 percent of commuters rode the rails to work.
Well before the Winston-Maheshri paper saw print, loyal Antiplanner opponent Victoria Transport Policy Institute published a critique by Jay Warner, a metallurgical consultant from Racine Wisconsin. The critique includes a lot of technical jargon like “auto correlation” and “exogenicity,” but basically Warner’s conclusion is that Winston & Maheshri’s paper is overly simplistic. Warner also criticizes the paper for failing to include commuter rail.
I think Warner is correct. But, possibly unlike Warner, I think that a more detailed analysis would conclude that all U.S. rail systems, including commuter rail and BART, are socially undesirable.
Because viagra discount store it will lower the SHBG it will allow for the testosterone total to become bio-available. generic viagra online A few medical conditions accountable for impotency are diabetes, heart disease, stress, depression and bad effects of medicines. PDE 5 breaks cgmp levitra properien in the penis refusing a male to fertilize the egg cell of a woman. Let us start by looking at a few examples of sexual crisis are erectile dysfunction, premature ejaculation, loss of libido, yeast infection, delayed ejaculation, impotence. brand viagra canada
Warner says that the paper’s “treatment of pollution reduction benefits is intellectually questionable.” I agree; the paper gives pollution a short shrift. As the Antiplanner has shown, most transit systems that include some form of rail transit consume more energy and emit more greenhouse gases, per passenger mile, than the average passenger automobile. The evidence available also suggests that rail transit systems emit more nitrogen oxides (a precursor of ozone smog) and particulates than automobiles.
My analysis did not include many of the recent commuter-rail systems such as Dallas, San Diego, and Seattle because those agencies did not submit fuel-consumption data to the Federal Transit Administration. But their ridership levels are so low that it is likely that their Diesel-powered trains are also heavy polluters per passenger mile.
Warner also says that the paper does “not include alternative costs of transportation for non-drivers.” This is a big problem because rail transit has so often proven harmful to non-drivers, i.e., transit-dependent people.
San Francisco is an excellent example. Thanks to the high cost of the BART system, the Bay Area’s bus systems have suffered limited funding. As a result, since 1980, the bus systems have lost far more riders than BART has gained. As the Antiplanner has shown elsewhere, most rail systems in the country have suffered similar losses of bus riders.
This is a huge equity issue. As Winston notes in his book, Alternate Route, the average income of rail riders is 25 percent greater than the average income of bus riders. Rail riders are much more likely to be “choice” riders — people who have cars who decide to take transit — while a much larger share of bus riders are transit-dependent. Sacrificing low-cost bus service that serves transit-dependent people in order to build rail lines that will give heavily subsidized rides to wealthy people who already have plenty of mobility is a clear case of taking from the poor to give to the rich.
Then there is safety. Heavy rail, which operates in exclusive rights of way, is safe. But light rail and commuter rail both kill more people, per passenger mile carried, than automobiles on urban streets and highways.
Finally, there is the urban-development angle. Many city officials claim that building rail will lead to urban redevelopment. Yet most such redevelopments are subsidized through tax-increment financing or similar supports. Rather than stimulating redevelopment, it appears that all rail really does is stimulate even more subsidies for redevelopment.
So rail transit does not get people out of their automobiles or cost-effectively reduce congestion, it harms transit-dependent people, it does not reduce pollution and at least some forms are more dangerous than autos. So where are the benefits of rail transit? And why do planners do so much to promote it?


If Winston and Maheshri can’t get a very simple fact straight, the accuracy of their paper is highly questionable.
On the very first page of their paper, they say:
In 1980, two million Americans got to work by rail transit. Today, in spite of an increase in urban jobs and transit coverage, fewer than one million U.S. workers commute by rail, caus-
ing its share of work trips to drop from 5 percent to 1 percent.
First of all, 2 million trips by rail to work they say was 5% of the 1980 U.S. total, or only 40 million jobs in 1980, in a country with well over 200 million people at the time?? These two academics who have earned PhDs are obviously math-challenged.
Winston and Maheshri cite the National Transit Database and the U.S. Census as their sources. However, while NTD includes ridership totals, there is absolutely no way to tell from that particular data source what trip purposes are.
As for the census, results from the “journey to work” question has been contradicted by direct passenger surveys. For example, in New York City alone, around half of subway trips are for work purposes, well over 2 million daily one-way trips. On BART, work-related trips are more like two-thirds of the total, around 230,000-240,000 one-way trips. Doing the math, current rail transit carries considerably more than two million work round trips daily.
Did Winston and Maheshri both to look at transit agency passenger surveys to get the most reliable data on transit trip purposes? NO. Did they count the costs of auto owernship avoided, which alone offsets rail subsidies, such as heavily documented by Reconnecting America and others? NO.
msetty – I think the issue may be that the numbers are for urban commuters. In 1980 the only census transportation data was the UTPP package that only covered urban areas (I’m not even sure if it covered entire MSAs at the time). In 1990 the CTPP was introduced that covered larger commuting zones. Glenn Fuguitt at UW Madison did a study on commuting patterns in 1980, “Commuting and the Rural-Urban Hierarchy.” Journal of Rural Studies 7:459-466, in 1991 but he had a specially constructed dataset to work with. If you restricted the rail transit figures to only urbanized populations, which is the demographic of the rail transit ridership, then 5% is probably in line. Other studies (including those of Fuguitt) have noted the increase in auto-based commuting beginning in the late 70’s and increasing in the 80’s. Another part of the story would be the expansion of urban areas between 1980 and 2000 – previously rural and lower density suburbanized areas have become integrated further into urbanized areas, but the residents of these areas mostly do not use transit and mostly commute by auto.
Regarding passenger surveys – they are only asking transit users, not the entire population which is what the census packages use. Morevover, the census is generally more thorough than the local transit studies. The confidence levels for the census data are also on the order of +/- 2%, while local transit surveys are in the neighborhood of +/- 40%, so they don’t really contradict anything except themselves most of the time. As for costs of auto-ownership – there are also costs to transit ridership, usually involving value-of-time, convenience and accessibility. Moreover, my car might break down, but so do trains, and I also don’t have to worry about a spotty, strike-prone labor force to get me to my destination.
skpeterson:
Morevover, the census is generally more thorough than the local transit studies.
No, actually most competent onboard transit surveys are quite comprehensive, and give a lot more attention to various details of transit passenger habits than the handful of Census questions regarding transportation.
The census journey to work question has extreme difficulties in dealing with trips that use multiple modes. If you park and ride, is your “primary” mode to work auto or transit? The census journey to work question also cannot deal in any reliable faction with people who may drive
one day, use transit the next, and stay home on Fridays. The overall totals for transit are probably +/- 10% reliable, but the Census question is a proven failure when trying to parse between bus, rail, streetcar, commuter rail, etc.
skpeterson:
while local transit surveys are in the neighborhood of +/- 40%, so they don’t really contradict anything except themselves most of the time.
Some evidence of this assertion, please. But as someone who has written and executed a number of transit surveys over nearly 30 years, I can say that this assertion is absolute bullshit, and I am certain there is no credible evidence to the contrary.
Onboard transit surveys are as accurate as any others, given sufficient sample sizes to be statistically valid. When the purpose of a trip is identified, one can compare the proportion of trips against ridership (allowing for tranferring) to get a reliable number of trips via transit, which in turn can be compared to the Census totals for journey to work and other sources to come up with a reasonably accurate estimate of transit mode share. The share for work trips by transit can range between 25% on the smallest community shuttles, to 80%+ for peak period only commuter rail lines. The most common range is 40% for large bus systems to 50%-70% for rail systems–the most recent surveys show that BART trip purposes are around 2/3 work.
If you take the entire transit industry, there are about 12 million daily one-way trips for work, or 6 million round trips. Divided by the roughly 100 million employed persons in urban areas over 50,000, times 1.6, allowing for various absences, sick leave, vacations, 9-80 working schemes and the like, this translates to an urban transit share of 7%-8%. Rail accounts for about half of all transit work trips, given the generally higher share of work trips compared to buses. So by my reckoning, there are approximately 3 million persons traveling to work by rail transit of various kinds, or 4% of the urban work force. This is rather impressive mode share, given that less than 10% of the U.S. urban population lives within walking distance of a rail station (6.3 million households do as of 2004, to be precise. Source: http://www.reconnectingamerica.org)
If you have alternative math, please show it.
MSetty is correct — I too noticed the error about census data in the Winston-Maheshri paper. Contrary to Winston-Maheshri, the 2000 census reported 2.6 million rail commuters, up from 2.1 million in 1980. But, as I noted in my post, rail’s share of commuting declined from 3.1 percent to 2.1 percent.
The error does not affect Winston-Maheshri’s other calculations, which are not based on census data, but it does suggest that care should be taken in using their numbers.
“…I think that a more detailed analysis would conclude that all U.S. rail systems, including commuter rail and BART, are socially undesirable.”
When you say rail systems, are you also talking about inter-city and long distance rail?
Here is an update on how the public gets light rail when they aren’t looking – it seems that one of the Metro councillors that is gung ho on light rail in Portland, also works for Parsons Brinckerhoff
As the Portland Tribune reported, Newman also worked “at the downtown Portland office of the Parsons Brinckerhoff planning firm”, which. as one Parsons document describes, “provides systems engineering for every kind of rail and mass transit project”. At the same time, while Newman also worked “for” Metro, Newman delivered the foundations of ” three new transit lines in the county that are either under construction or in the active planning stages. They include TriMet’s new light-rail line along Interstate 205, the planned light-rail extension between downtown Portland and Milwaukie, and a new line between Portland and Lake Oswego.”
I’m sure Parsons Brinckerhoff really appreciated this.
Parsons Brinckerhoff is posed to make millions to Billions from Newman’s work at metro promoting an obsolete, high cost toy train that only makes congestion worse. I wonder if he got a bonus? (Anything less than $10 million would be an insult, for delivering a potential BILLION in business to his other employer.)
Way to go Newman, put a few dollars in your pocket and screw the taxpayer out of Billions and make congestion worse.
Does anyone consider this a conflict of interest? (At least Cheney had the decency to quit Haliburton.)
links:
Thanks
JK
Trumbull,
I was not including intercity rail in my blanket statement — just urban rail. However, I suspect the same is true of intercity rail. I plan to do a major study of high-speed rail in 2008 and will be able to answer this question better then.
Subsidies to Amtrak are somewhere between subsidies to highways and transit: highways are about a half cent per passenger mile; transit 65 cents; and Amtrak about 20 cents. I suspect that Amtrak does not provide 19 cents worth of benefits, but I haven’t studied it enough to say for certain.
With the simple arithmetic and other errors in the Winston-Maheshri paper that even Randal noticed, I don’t think ANY part of the paper can be trusted, and is not a credible reference for rail opponents. With such obvious errors, how did it get past peer review?
Here’s a paper that supports AP’s points and also backs up Winston and Maheshri: http://muse.jhu.edu/journals/brookings-wharton_papers_on_urban_affairs/v2005/2005.1baum-snow.html
Their results show that only Washington, D.C. has experienced significant welfare gains relative to costs in expanding rail service. They also look into some of the externalities such as pollution. Indications as well that most rail transit ridership significantly cannibalizes existing bus ridership without inducing large numbers of auto drivers to switch modes. Most of the welfare gains are in time-savings of rail v. bus.
The URL for the paper mentioned by SKPeterson requires a password, but the paper can be downloaded from one of the authors’ web pages.
Indications as well that most rail transit ridership significantly cannibalizes existing bus ridership without inducing large numbers of auto drivers to switch modes.
Not so. Total Washington Metro ridership has more than doubled since rail service began in 1976, and the vast majority of Metro rail riders are “choice” riders with access to automobiles. Bus ridership has been static since the 1970’s, so the “cannibalization of existing bus riders” is simply a debunked theory.
msetty Total Washington Metro ridership has more than doubled since rail service began in 1976,
JK: As usual, the planner left out an important detail: how has population changed? Demographics changes?
For instance, Portland makes the same brag, but when adjusted for population increase, transit’s market share increased by 1% over a full decade (0.1%/year). At that rate, they will have ½ of us out of our cars in only 500 years.
msetty and the vast majority of Metro rail riders are “choice†riders with access to automobiles.
JK: Same in Portland with its 1% per decade market share increase. Oh, I almost forgot that decade was 1990-200, the latest full census data, but both were down from the 1980 census.
msetty Bus ridership has been static since the 1970’s, so the “cannibalization of existing bus riders†is simply a debunked theory.
JK: Of course, they never double count people who now transfer for bus to toy train where they previously made the whole trip on bus. Yeah, right. I think the planner needs to show us the numbers on this claim.
Thanks
JK
The same sort of ridership growth has occurred in Sacramento and other new rail cities, where bus ridership also remained static or even increased a bit. Obviously skpeterson didn’t read the very informative comments from Richard Voith at the end of the Baum-Snow paper.
As a non-economist, I find the general anti-rail stance of many economists to be quaint, given that the many more people who are pro-rail have a much broader, more realistic perspective. The myriad shortcomings of the current autistic economics has been described by those much more versed in this, however, than I.
If I understand Kahn’s work correctly (I’ve read much of it), he finds some welfare benefit but not much, and his book expands on this idea as only one utensil in the drawer.
DS
Jim,
Did you notice the little piece in the Tribune about Portland Commissioner Eric Sten’s new $1.25+ Million house?
http://www.portlandtribune.com/news/story.php?story_id=118945876994466600
Despite telling the paper that he just consolodated equity from a bunch of inherited properties, the county records show a $1 million mortgage on the property. I wonder if he is working for Parsons Brinckerhoff too.
msetty – I read Voith’s comments – I don’t see how he’s exactly contradicted Baum-Snow and Kahn. I would argue that his final comments on how there are several factors affecting transit ridership so that measuring effects is problematic puts an even greater onus on supporters of rail to justify the increased expense of rail transit v. bus or increasing highway lane capacity. Dan’s quote from Kahn above indicates that increase in transit use from rail construction might work in a few cases but that the success is contingent upon the spatial distribution and growth of the urban population and the location of employment. It appears to work in D.C., maybe Boston, the authors are unsure about Chicago, hopeful for Seattle and cautious about Atlanta.
P.S. – I’m not really an economist either, I’m an economic geographer and my research is in freight rail transportation. I find it quaint that so many broad-minded people are fascinated by spending exorbitant sums of money on only a few miles of rail infrastructure. It’s probably my blinkered vision of rail as a long-distance operation, but I don’t think of rail as being an efficient transit mode when it only operates on a few miles of track; the economies of scale and density just aren’t there. Now, if you wanted to talk about high-speed inter-city rail that’s a different story.
Well, Mr. Peterson, I was a Geography major, so I generally don’t put too much stock in economists, mainly because of how they can be blinkered. In terms of economies of scale, the number of daily trains over a given stretch of rail transit is much more intense than any freight or intercity passenger service I’m familiar with. Of course the number of passengers is the key here, but urban vs. intercity rail is definitely apples vs. oranges.
As for the various studies of rail transit mainly by economists, I think there was a long laundry list of factors that weren’t considered by Baum-Snow and Kahn, as outlined here. Urban transit is a much more complex subject than freight rail, I’m afraid.
My associate Leroy Demery and I have undertaken some original research on the topic of minimum economic thresholds justifying investment in rail transit. The Portland MAX system is well above what we found; the Portland Streetcar is below this figure, but is in a reasonable range for downtown shuttles. In my view, surprisingly large up-front costs for rail can be justified based on a number of things, such as reduced operating expenses compared to buses, savings in vehicle ownership, and so forth.
One of the findings of Reconnecting America, based on the 2000 Census data was that, on average, households within 0.5 mile walking distance of rail stations owned 0.7 fewer vehicles compared to areas more than 0.5 miles away. On an aggregate basis, this is a reduction of 4.2 million vehicles; at $4,000 per year average expense per vehicle (based on current fuel prices), this is an aggregate savings of $16 billion per year. There is also additional savings for households who live in areas with high frequency local bus service, but I haven’t seen any studies of that particular area.
I suppose one could argue “self selection” but there are also a few studies that have convincingly debunked that notion, too.
Regarding more about where I’m coming from, if you email me at msetty@publictransit.us, I can email you copies of our research, particularly the traffic density threshold paper. Someday when I have the time, I certainly want to take this material to the annual TRB meeting (I get paid for transit plans for local operators, not for less specific analysis, unlike Randal!)
I suppose one could argue “self selection†but there are also a few studies that have convincingly debunked that notion, too.
I’m getting more discussion time from the fiancée that after we get married we move closer to the CBD, as her house is in McSuburb; she wants walkability and amenities and proximity to transit (she’s not a planner, just practical, and she likes Denver’s rail).
As markets expand due to restrictive zoning regalayshuns being repealed, more people will be making this choice. Until then, there are those of us who will self-select to be closer to TODs, to live in TNDs or NU neighborhoods, to live close to a good bus stop. I know I sure miss being close to the 26 in Seattle, which got me to where I didn’t want to go on my bike. I didn’t really care for the exurb I moved to after that, because to get to anything other than the ale house, grocery or friend’s house meant getting in the dreaded car.
Anyway, self-selection: f yeah.
DS
On September 11th, 2007, msetty said:
Indications as well that most rail transit ridership significantly cannibalizes existing bus ridership without inducing large numbers of auto drivers to switch modes.
Not so. Total Washington Metro ridership has more than doubled since rail service began in 1976, and the vast majority of Metro rail riders are “choice†riders with access to automobiles. Bus ridership has been static since the 1970’s, so the “cannibalization of existing bus riders†is simply a debunked theory.
That may or may not have happened in Washington or some other places, but cannibalizing of bus routes is exactly what happened here in Houston when we built our light rail line. In FY 2000, our transit agency reached 101 million boardings. This year, FY 2007, the agency is on its way to achieving 98 million boardings despite the fact that the Houston Metro service area has added some 500,000 people in the past 7 years.
I have a spreadsheet which can be downloaded here:
http://tinyurl.com/25cyvb
which has the Houston Metro boardings for all bus routes and rail stops from 1997 – 2005. An update through 2007 will be published in the next 2-3 months. A brief overview of the facts are:
1) The Houston 7.5 mile light rail line is drawing 40,000 passengers per day. This is celebrated as a huge success story. What most do not know is that the bus routes which ran in the corridor before the rail line was installed used to carry 25,000 – 30,000 boardings per day. The capital cost of the light rail line was published at $324 million, but the actual final cost came out to be $520 million. The agency was sitting on top of some $350 million of local sales tax monies before the line was built, which was emptied to build it. Then the agency had to skimp on commitments to complete the rest of it over the next few years. According to the NTD, annual operational costs of the rail line are $14 million per year.
2) The cost of fuel to the agency for running buses has gone up about $30 – $35 million since FY 2000. However, the rise in fuel costs could have been handled by two factors – if the agency had not spent the cash pile it had been sitting on top of, but instead had invested it in bonds; and by not building the light rail line the agency would have saved the O&M costs.
3) The cost of salary increases, pensions, and health care for the nearly 4,000 employees has gone up (in real terms) about $30 million, but the sales tax revenues to the agency have skyrocketed since $70 a barrel oil has caused Houston to boom economically.
4) Agency boardings were actually in the 93-97 million range in the immediate aftermath of the light rail line construction. Then Hurricane Katrina hit and Houston Metro saw a 7 percent spike in boardings overnight to about 102 million in FY 2006. However once again the boardings are again drifting downwards.
5) In reaction to these events, Houston Metro then did exactly what Anti-Planner often complains about. The following bus routes were either cut, truncated, or rerouted after the rail line was built:
A) 5 local downtown Houston cirulator trolley routes were cut, as well as 6 others which had boardings of less than 1,000 passengers.
B) Here are sample boardings From FY 2000 to FY 2006. What follows are the route numbers, the name of the route, then the boardings comparisons:
#18 Kirby – a bus route that runs right by where I used to live, used to have service every 15-25 minutes. Boardings used to be 1,400 per day. After the light rail line was built, service was cut to once every 30-35 minutes and boardings dropped to 950 per day.
#25 Northline dropped from 3,900 to 3,450 during 1999-2000 to 2005.
#23 Crosstimbers dropped from 2,690 – 2,800, to 2,450.
#25 Richmond dropped from 8,000 to 7,000 riders. There is no difference in Richmond other than it was moved 1-2 blocks off of Main.
#26 / #27 Outer – Inner Loop dropped from 6,600 – 6,900 to 5,500.
#30 Clinton and Cullen routes lost about 10 percent ridership. The Clinton went from 1,200 to 1,075 while the Cullen went from 3,400+ to 3,100.
#33 Crosstown Post Oak went from 6,900 to 6,000.
#54 Aldine Hollyvale peaked at 963 riders in 1999, but nosedived every year until 2005. The route was cancelled in 2006.
#8 Main Street bus route, both North and South Main was getting 8,500 riders in 2000, but 6,000 by 2005-2006. The South Main route was getting 6,750-7,000 riders in 2000, but only 4,750 in FY 2006. The North Main route was getting 1,900 riders in 2000, but only 1,200 – 1,300 in FY 2006.
#60 MacGregor / Hardy was getting 2,000 riders in 2000, but 1,600 in 2006.
#65 Yale / Bissonnet was getting 12,000 riders in 2000, but 9,000 in 2006. Especially look at the Yale route.
#78 Alabama / Irvington was getting 2,400 riders in 2000, but 1,700 riders in 2006.
#15 The Fulton route has kept its ridership at 3,000.
#5 Kashmere Southmore went from 6,900 riders in 2000 to 6,000 in 2006.
#1 Hospital route has declined from 6,500 – 6,800 in 2000 to 5,700 in 2006.
#4 Jensen / Beechnut declined from 9,200 in 2000 to 7,400 in 2006.
#50 Heights / Harrisburg went from 5,277 / 4,680 in 2000 to 4,499 / 3,990 in 2006.
#132 Harwin Express declined in boardings from 3,160 in 2000 to 2,100 – 2,400.
Neal
RE: “Self Selection”
From the article noted by Randal in today’s post:
The distances driven were also noted. Exercisers in walkable neighborhoods drove 26 miles a day, while those in non-walkable neighborhoods drove about 37 miles.
Among non-exercisers, those in walkable neighborhoods drove 26 miles, and compared to 43 miles in areas that were mostly car-friendly.
So much for the idea that the driving habits of those who “self select” into walkable areas don’t change their habits, regardless of where they live. Those who drive and still don’t walk drive the same mileage in walkable neighborhoods as those who DO walk. Thus urban structure does make a rather large difference in driving distances traveled. This is entirely consistent with the findings of Reconnecting America I’ve mentioned before.
RE: Houston Impact of LRT on Bus Usage Posted by Neil
Obviously the Houston LRT reduced ridership on parallel routes because the system was deliberately restructured to do so. LRT ridership in the corridor is significantly higher than previous bus usage, consistent with my research and others that indicate a “rail preference factor” of 35% to 40% (documents on request).
As for the patronage drop on other routes (most did NOT parallel the Houston LRT route, as made clear by a look at the Houston Metro route map), there was a declining ridership trend a few years before LRT began in 2004, in the wake of 9/11. This was a common experience at most large transit systems in the U.S., not just Houston. So let’s not stretch the argument against LRT too far–not that irrelevancies ever stopped the more outspoken rail critics.