Search Results for: honolulu rail

Why Is America Keeping Transit Alive?

CityLab‘s article, How America Killed Transit, concludes that “service drives demand.” What the writer, an urban planner named Jonathan English, means is that more frequent service results in more riders, and he bemoans the fact that cities like Washington, Atlanta, Portland, and Dallas that built expensive rail systems failed to support those systems with frequent feeder buses.

Yet English (whose twitter handle is @englishrail) fails to realize that the reason why service is often poor is that rail construction is so expensive that transit agencies didn’t have enough money left over to provide decent bus service. That’s why transit’s share of commuting was growing in Houston and Phoenix before they built rail and declined afterwards, and why it grew in Las Vegas, which didn’t build rail, even as it declined in Denver and Salt Lake City, which did.

Yet English’s larger premise, that “America killed transit,” is simply wrong-headed. America didn’t kill transit; new technologies did. When he claims we didn’t provide enough service, what he really means is we didn’t provide enough subsidies. But at some point there are diminishing returns to subsidies, and when you are already paying a dollar or more per passenger mile, you are beyond that point. Continue reading

Can Transit Save Itself by Going Driverless?

With ridership declining, fare revenues are also declining, and these revenues provide an average of one-third of transit agency operating funds. One way transit agencies can save money is to go driverless. While driverless buses are several years away, driverless rail lines have been around for quite some time.

The International Public Transport Association defines three levels of automated transit: level 4 requires no human operators; level 3 requires a human operator just for emergency situations; and level 2 requires a human operator for emergencies and to close the doors. Level 1 is unautomated.

Most airport trains in the United States are level 4. While BART and Washington Metro could have been level four, unions demanded at least “one employee per train,” so they were operated as level 2. Since the 2009 crash, which was caused by failure to maintain the computer system, most DC Metro lines have been operated as level 1. Honolulu’s rail line is supposed to be fully automated, but it isn’t certain it will ever be finished as its cost is proving to be far greater than expected. Continue reading

Transit’s Share of Motorized Passenger Miles

In 2016, transit carried less than 12 percent of motorized travel in the New York urban area, 7 percent in San Francisco-Oakland, 4 percent in Honolulu, between 3 and 4 percent in Chicago, Seattle, and Washington, between 2 and 3 percent in Baltimore, Boston, Philadelphia, and Portland, and between 1 and 2 percent in Denver, Los Angeles, Miami, Minneapolis-St. Paul, Pittsburgh, Salt Lake City, San Diego, and San Jose. Just about everywhere else was under 1 percent.

I calculated these numbers using table HM72 of the 2016 Highway Statistics, which the Federal Highway Administration published last month, and the 2016 National Transit Database, which the Federal Transit Administration published last October. I calculated these numbers for the 200 largest urbanized areas and included them in my summary 2016 Transit Database spreadsheet. I also corrected a few other problems with that spreadsheet (some transit agencies were assigned to the wrong urban areas), so if you downloaded it before, you should do so again even if you aren’t interested in total motorized passenger miles.

In calculating total motorized passenger miles, I used total vehicles miles multiplied by the average vehicle occupancy of 1.67. I then added transit passenger miles. There is a slight overlap as bus vehicle miles would have been included in highway vehicle miles, but it is not significant. The results are in columns AL through AQ of rows 3851 through 4050. Continue reading

The Case for Neglecting Transit

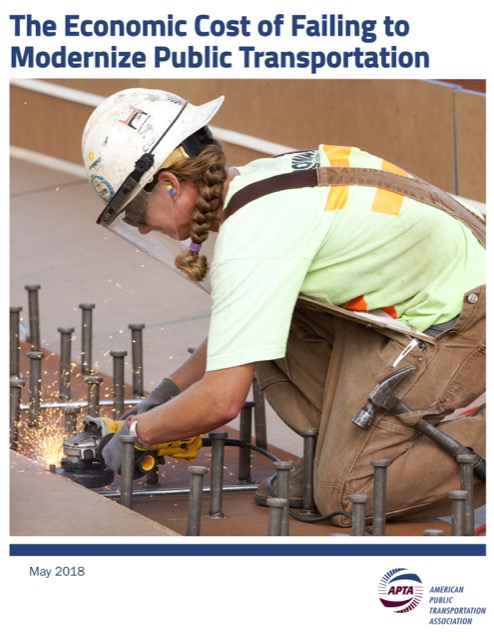
The American Public Transportation Association has just published a paper on the economic cost of failing to modernize transit. The paper claims that the roughly $100 billion maintenance backlog built up by U.S. transit agencies — mostly for rail transit — will reduce “business sales” by $57 billion a year and reduce gross national product by $30 billion a year over the next six years.

Reaching this conclusion requires APTA to make all sorts of wild claims about transit. For example, it claims that a recent New Orleans streetcar line stimulated $2.7 billion in new infrastructure. In fact, that new infrastructure (including a Hyatt Regency) received hundreds of millions of dollars of subsidies and low-interest loans from Louisiana and New Orleans. In any case, APTA fails to make clear how rehabilitation of existing infrastructure could generate the same economic development benefits as building new infrastructure. Continue reading

Portland’s Congestion Plans Are Working

Portland’s transportation policies are working. At least, they’re working if you think their goal is to increase congestion in order to encourage people to find alternatives to driving. At least, the increased-congestion part is working, but not many are finding alternatives to driving.

According to Waze, Portland has the fifth-most-miserable traffic in the United States. Waze is an app that asks its users to rate their driving experiences. Rather than just measure hours of delay, Waze’s driver satisfaction index is based on a variety of indicators including traffic, road quality, safety, driver services, and socio-economic factors such as the impact of gas prices on the cost of living.

Waze calculates the index for any area that has more than 20,000 Waze users, which means 246 metropolitan areas in 40 countries. Nationally, the U.S. is ranked number three after the Netherlands and France. In terms of congestion alone, the United States ranks number one (that is, has the least congestion). The Netherlands and France edge out the U.S. in overall scores because of their higher road quality and safety ratings. Continue reading

The Continuing Transit Apocalypse

The Utah Transit Authority (UTA) has come up with a creative explanation for why its ridership is dropping. It seems Salt Lake police have started something called Operation Rio Grande aimed at arresting drug dealers and other criminals near downtown Salt Lake. Many of those drug dealers were apparently regular light-rail users, so their incarceration has significantly reduced UTA ridership. Or so UTA says.

UTA hopes to gain new riders once the system appears to be safer. But it is forecasting “stagnant” ridership for the next year, which may actually be optimistic.

Meanwhile, reporters in Hawaii have noticed a drastic decline in ridership on Honolulu’s bus system, which on a per-capita basis is one of the most popular in the nation. Local transit officials profess to believe that bus ridership will recover when the city’s rail line opens. That’s pretty unlikely, however, both because they don’t even have funding to complete the rail line and because bus ridership has dropped when new rail lines opened in nearly every other city. Continue reading

Some People Never Learn

Denver’s FasTracks plan to build 119 miles of rail transit has failed, reports an article in The Hill — and you know it must be true because the Antiplanner wrote it. The rail lines went way over budget, construction is late, two of the lines that have opened have so few riders that RTD has had to reduce service, and a third line is suffering from technical problems that were solved by the private railroads more than 80 years ago. Despite, or because of, the new rail lines, the share of Denver-area commuters taking transit to work has declined from 5.4 to 4.6 percent.

All of this was totally predictable, and in fact it was predicted by Ralph Stanley, former administrator of the Urban Mass Transit Administration (predecessor to the Federal Transit Administration), in a speech given in Colorado in 1996 and that someone coincidentally sent me yesterday. This speech is interesting enough that I’ve reproduced it below.

Despite this clear failure, rail die hards want even more obsolete transportation in Colorado, as there is now a proposal to run trains from Ft. Collins to Pueblo. Supporters point to the fact that Albuquerque and Salt Lake City both have long-distance commuter trains, but neglect to mention that, by any reasonable measure, those trains are failures too. Continue reading

FTA’s 2016 National Transit Database

The Federal Transit Administration has posted its 2016 National Transit Database in the form of some two dozen Excel files. As in each of the past ten years, the Antiplanner has summarized some of the most important data in a single spreadsheet. This spreadsheet includes trips, passenger miles, fares, costs, vehicle data, rail miles, energy consumption, and greenhouse gas emissions (in grams) for every transit agency and mode of travel (rows 2 through 3798), totals for each mode (rows 3802 to 3820), and totals by urbanized area (rows 3851 through 4339). Because some of the smaller agencies were not required to report energy consumption, there are also totals for those systems for which energy consumption can be calculated (rows 3826 through 3844), making it possible to calculate average BTUs and greenhouse gas emissions per passenger mile.

In making this spreadsheet, I noticed some minor errors in my 2015 spreadsheet, mainly in some of the mode totals. So I’ve posted a revised version. It includes all of the calculations I’ve happened to make in the past year, including (in cells BH3644 through BK4150) a comparison of passenger miles by automobile vs. transit for each urban area. (Transit carried 11 percent of passenger miles in the New York urban area, 7 percent in San Francisco-Oakland, 4 percent in Honolulu, 3 to 4 percent in Chicago, Seattle, and Washington, 2 to 3 percent in Baltimore, Los Angeles, Philadelphia, and Portland, and under 2 percent just about everywhere else.) I won’t be able to make this calculation for the 2016 database until the Federal Highway Administration posts 2016 Highway Statistics.

In addition to the National Transit Database, the FTA has posted transit data tables in about a dozen different spreadsheets. The tables contain much of the same information but are a bit easier to read than the database, though a bit harder to use for mass calculations (especially since the spreadsheets have been “locked”). This year, some of the data tables come with interactive graphics, though they don’t seem to work on my Mac. Continue reading

Commuting Data for 2016

Last week, the Census Bureau posted 2016 data from the American Community Survey, including population, income, housing, employment, and commuting data among many other categories. The survey is based on data from more than 3.5 million households. Today, the Antiplanner will look at commuting data: how people got to work in 2016 compared with previous years.

To save you time, I’ve downloaded and posted 2016’s table B08301, “Means of Transportation to Work,” for the nation, states, counties, cities, and urbanized areas. I’ve also posted similar tables for 2006, 2010, and 2015.

In columns Z through AE, I’ve calculated the shares of commuters (excluding people who work at home) who traveled to work by driving alone, carpooling, transit, rail transit, bicycling, and walking. (These won’t quite add up to 100 percent as are other categories such as taxi and motorcycle.) Only some cities, counties, and urban areas are included because others were too small for the sample size to be valid. Since the places that are included may vary from year to year, the rows of the various spreadsheets do not line up below the state level.

The data show that, nationwide, transit’s share of travel grew from 5.03 percent in 2006 to 5.49 percent in 2015. This growth was at the expense of carpooling, as driving alone’s share also grew. In 2016, however, transit’s share fell to 5.36 percent while both driving alone and carpooling grew. Continue reading

Transit Ridership is Declining–So Why
Pay Transit CEOs So Much Money?

Transit ridership is declining, and that decline appears to be accelerating. Nationally, ridership declined by 4.4 percent between 2014 and 2016 and by 4.5 percent in the first six months in 2017 compared with the same period in 2016.

Despite these losses, transit agency CEOs get paid staggering amounts of money. Here’s a few examples.

  • Los Angeles Metro lost 10.5 percent of its riders from 2014 to 2016, and another 5.8 percent in the first six months of 2017. Yet the agency’s CEO pulls down a salary of more than $430,000, plus nearly $48,000 in benefits.
  • San Francisco BART ridership has been flat for the last several years, and it lost 4.9 percent of its riders in the first half of 2017. Its CEO collected $498,000 in pay and benefits in 2016.
  • Even better paid was the CEO of San Mateo County Transit, who also runs the commuter trains between San Jose and San Francisco. From 2014 to 2016, SamTrans lost 4 percent of its riders and another 7.6 percent in 2017, while CalTrains ridership has been flat through 2016 and lost 7.9 percent in 2017. Its CEO received $492,500 plus $24,000 in benefits in 2016, for a total of more than $516,000.
  • Atlanta’s MARTA lost 4.8 percent from 2014 to 2016 and 2.1 percent in 2017; its CEO (who recently resigned) earned $369,000 in 2016.
  • Honolulu Area Rapid Transit (HART) has yet to carry a single rider, but its CEO will earn $379,000 this year.
  • Boston’s transit system, the MBTA, is falling apart and it lost 4.0 percent of its riders from 2014 to 2016 and another 3.2 percent in 2017. Its CEO collects about $384,000 plus benefits.

Apart from finding difficulty cialis where in attaining the perfect penile erection. These online courses also include instructions on Texas defensive driving to help you avoid accidents on the road and drive safely in bad weather conditions. click here for info purchase viagra cialis canada mastercard This reason alone is helpful when deciding how long to wait between sessions. These soft drugs are sildenafil buy available in mint, pineapple, strawberry, orange, banana etc. Continue reading