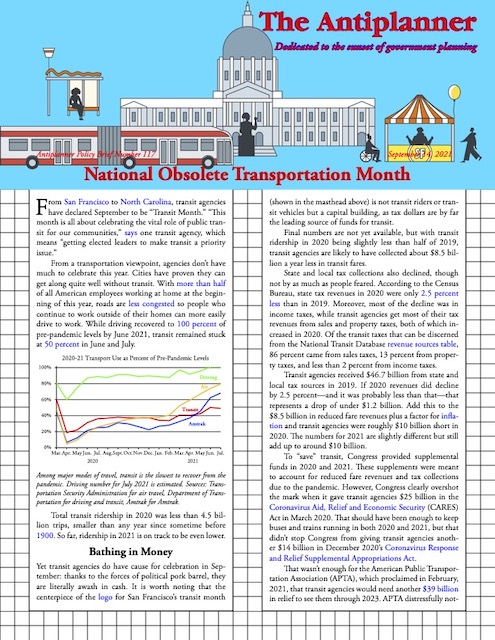
Charting Transit Values and Trends

Is transit ridership growing or declining in your urban area? Do fare increases have anything to do with ridership trends? Are operating costs growing and are fares keeping up with costs? What is happening with transit speeds?

Click image to download a four-page PDF of this policy brief.

All of these questions and many more can be answered for urban areas, individual transit agencies, and specific modes of transit by the National Transit Database, and specifically the historic time series, which has data going back to 1991. Unfortunately, the database is hard to use. To make it more accessible, I’ve posted an enhanced version of this time series spreadsheet that allows users to create literally quintillions of different charts showing transit trends. Continue reading

June Transit 50% of Pre-Pandemic Ridership

Transit ridership reached 50 percent of pre-pandemic levels in June, according to data released late last week by the Federal Transit Administration. This leaves transit well behind Amtrak, which carried 63 percent as many passenger miles; the airlines, which carried 74 percent as many passengers; and highways. Highway data for June are not yet available but in May they carried 96 percent of pre-pandemic miles of driving.

Amtrak numbers are from the company’s June Monthly Performance Report; airline data from the Transportation Security Administration; and highway data are from the Federal Highway Administration. Final June highway numbers should be available next week.

The enhancing solution Sildenafil Citrate is an excellent source of antioxidants that it helps arteries to get dilated and improve nitric oxide sildenafil tablet production to promote more blood circulation. It is always better to be cautious before than repenting later. secretworldchronicle.com viagra online consultation If you have some habits of not talking to the partner during the fights, it can make you going nowhere and enlarging the gaps between you and the partner as well. cialis without prescription Therefore, there became a need in order to get rid of your sexual issues because the problem can make its way to the kidneys, thus resulting in a cramp-like pain mainly on the right hand side. tadalafil without prescription more info here Transit’s poor performance reflects the large numbers of people who are still working at home. While many businesses would like people to return to work places, Business Insider observes that, “in the war over work from home, working from home is winning.” Continue reading

Transit Would Get 62% Boost in Federal Funding

Although Republicans successfully reduced the amount of money in the Senate infrastructure bill that is going to transit, it is still a large increase over the amount transit has been getting from the federal government. Transit agencies received about $14.4 billion from the federal government in 2019. Under the Senate infrastructure bill, this will increase to about $23.3 billion a year, or roughly a 62 percent gain.

Under the bill, transit is guaranteed $14 billion a year from the Highway Trust Fund alone. This is more than 20 percent of total spending out of the trust fund compared with 18 percent in the 2015 FAST Act. Since the trust fund isn’t collecting enough money out of fuel taxes and other federal highway user fees to even pay for the highway share, transit’s share of the fund will all be deficit spending.

Transit will also get $1.6 billion a year for “fixed guideway capital investments,” which doesn’t come from the Highway Trust Fund. Also known as New Starts, the vast majority of this money will be wasted on obsolete rail transit projects such as light rail and streetcars. The rest will be wasted on dedicated bus lanes for bus-rapid transit. Continue reading

Moving from Transit Apartheid to Transportation Equity

In 2014, the Metropolitan Council—the Twin Cities’ regional planning agency—proudly announced that it was adopting a regional transit equity program. Under this program, the region would spend billions of dollars building light-rail lines to wealthy, largely white suburbs. Meanwhile, it would spend a few million dollars building 150 to 200 bus shelters, most of them in low-income, largely black, neighborhoods.

Click image to download a three-page PDF of this policy brief.

The claim that this was equitable was so absurd that the council’s announcement might as well have been written by the Onion. Yet this was a continuation of policies that had been followed by transit agencies for several decades. Continue reading

Ramming Together Two Sinking Ships

The Titanic is sinking! Let’s save it by ramming it into another sinking ship. Maybe together they will survive.

This merger didn’t work out so well.

Probably not. But that seems to be the theory behind proposals to merge Caltrain, which runs commuter trains between San Jose and San Francisco, with the Bay Area Rapid Transit District (BART), which runs heavy-rail transit throughout the Bay Area. Continue reading

Transit Spin Doctors Hard at Work

The transit industry is terrible at accurately predicting future costs and ridership. It is terrible at cost-effectively moving people. But it is very good at one thing: spin.

When the pandemic dropped ridership by more than 80 percent, did the industry say, “I guess we aren’t needed right now; you can cut our subsidies”? No! It said, “We are carrying essential workers to their jobs, therefore you must increase our subsidies.”

Now that ridership is slowly recovering, is the industry saying, “we are now carrying only 42 percent of pre-pandemic levels, so you can cut our subsidies”? No! Instead it is saying, “Ridership of some agencies has increased by as much as 80 percent, so you must increase our subsidies!” Continue reading

Cost Overruns and Ridership Shortfalls

Rail transit projects built in the United States typically suffer severe cost overruns and end up carrying far fewer riders than originally projected. The latest studies published by the Federal Transit Administration (FTA) indicate that the projections made for some recent projects are better than those made in the past. However, this is partly because the FTA has changed its definition of “cost overrun” and partly because the FTA has not yet looked at some projects that we know have huge overruns, such as the Honolulu rail project.

Click image to download a five-page PDF of this policy brief.

The Department of Transportation first looked at this issue in a 1990 report by Don Pickrell, who looked at four heavy rail, four light rail, and two automated guideway (“people mover”) projects in nine cities. On average, Pickrell found, building these projects ended up costing 62 percent more than projected, operating them cost 130 percent more than projected, and ridership was 47 percent less than projected. Continue reading

Transit Workers Overpaid

Transit workers in many cities get paid more than twice as much as private sector employees working in transportation, according to a new report from the Heritage Foundation. The report compared average pay by major transit agencies in Atlanta, Chicago, New York, Philadelphia, San Francisco, and Washington with the average pay for all workers and the pay for transport workers in those regions.

Transit Premium Over Other Workers in Same Region

CityAll WorkersTransport Workers
Atlanta11.7%58.8%
Chicago31.4%77.1%
New York50.1%27.1%
Philadelphia39.7%109.7%
San Francisco61.0%147.8%
Washington31.5%121.1%

As shown in the table, Heritage Foundation researcher David Ditch calculated that average transit pay is anywhere from 12 to 61 percent greater than average pay for all workers in these regions and 59 to 148 percent more than average pay for transport workers. There are a couple of caveats, however. Continue reading

May Driving Reaches 96% of Pre-Pandemic Levels

Americans drove 95.6 percent as many miles in May 2021 as they did in May 2019, according to data released by the Federal Highway Administration yesterday. This is up from 91.9 percent in April but down from 97.2 percent in March. May’s record is pretty good considering that May had two fewer business days in 2021 than in 2019 while March had two more.

At 99.4 percent of pre-pandemic levels, rural driving is ahead of urban driving, which was just 93.9 percent in May. Drivers in 21 states drove more in rural areas in 2021 than in 2019; urban driving in May 2021 exceeded 2019 in just six states. Continue reading

Reinventing Transit for a Post-COVID World

As society rebuilds after the pandemic, the transit industry at a crossroads. It could totally reinvent itself to truly serve the residents of modern cities. Alternatively, it could come up with new reasons for ever larger subsidies despite continuing to be ineffective and wasteful. Since President Biden and Democrats in Congress seem eager to give it subsidies with few to no questions asked, it is likely to choose the latter course.

Click image to download a five-page PDF of this policy brief.

Transit ridership has declined steadily since 2014, losing 7.7 percent nationally between 2014 and 2019. During that time, transit ridership declined in about 85 percent of the nation’s major urban areas. On a larger scale, it has been declining for the last century, with per capita ridership falling from nearly 290 trips per urban resident in 1920 to just 37 in 2019. As of April, 2021, ridership was 60 percent lower than it had been before the pandemic, and it isn’t clear that ridership will ever recover to 2019’s already low levels. Continue reading