Search Results for: plan bay area

Notes from All Over

Tomorrow the Antiplanner will review more 2017 census data, but today I’ll briefly comment on a few events that took place while I was reviewing census data last week. First, the New York Metropolitan Transportation Authority is blaming subway delays on the passengers, claiming that late-arriving riders sticking their feet in the doors as they are closing are responsible for slow trains. Because no one ever did that before this year!

Speaking of the MTA, a member of MTA’s board is suing Mayor de Blasio and New York policy commissioner James O’Neill for their failure to release data on subway fare evaders. Because it is easier to blame financial problems on someone else than it is to actually do your job of overseeing the agency’s finances.

Speaking of fare evaders, San Francisco’s Muni is upset to discover that one out of four transit riders on the city’s famous cable cars aren’t asked if they have paid their fares. Since most riders pay before they board, this doesn’t mean that one in four haven’t paid, only that they haven’t had their tickets checked by the conductor. Continue reading

California Bill Threatens Neighborhoods

Speaking of the San Francisco Bay Area, as the Antiplanner was doing yesterday, the California legislature may be on the verge of passing a bill that will make that crowded region even more congested. Assembly Bill 2923 would allow, even require, that the Bay Area Rapid Transit Authority to overrule local zoning and impose high-density housing on neighborhoods within a half-mile of BART stations.

Not surprisingly, many cities including Fremont, Hayward, Lafayette, and Pleasant Hill oppose this preemption of their local authority. More surprising is opposition from the California chapter of the American Planning Association. While the APA supports minimum-density zoning, it doesn’t believe that transit agencies should be allowed to preempt local cities. Apparently, more APA members work for cities than for BART.

The bill’s advocates argue that high-density housing will be more affordable, a myth the Antiplanner has addressed before. Mid-rise construction costs 50 percent more and high-rise costs 68 percent more per square foot than low-rise housing. Land in areas with urban growth boundaries can be hundreds of times more expensive per acre than areas without boundaries, so densities would have to be that many times greater to get land costs per unit of housing down to reasonable levels. Continue reading

Let’s Be as Dense as Hong Kong

Vox‘s Johnny Harris looks at housing in Hong Kong, noting that it is rated the least-affordable housing market in the world. (At least the English-speaking world, China, Japan, and Singapore, which are the housing markets reviewed in Wendell Cox’s 14th International Housing Affordability Survey). Harris shows living conditions roughly similar to the 1890 tenements of New York City documented by Jacob Riis in How the Other Half Lives.

Harris reveals that housing prices aren’t high because Hong Kong has run out of land. Instead, he notes, “Flying over Hong Kong, you start to see that, while yes, there’s a very dense urban landscape, but there’s also a whole lot of green space. Government land-use data says that 75 percent of the land in Hong Kong is not developed.” Continue reading

The Wildfires of Summer

It’s the height of summer, which means the Antiplanner is thinking about hiking in nearby national forests before they get filled with smoke from wildfires. This year has already seen 3.4 million acres burn, mostly in the South and the Rocky Mountains. That’s slightly more than average, but big fires in the Pacific Coast states have yet to come.

A friend of mine forwarded to me a copy of a letter from a retired logger to his Congressional delegation criticizing the Forest Service and other federal land agencies for their firefighting tactics. He remembers when firefighters engaged in “direct attack,” meaning they drove or hiked to the edge of the fire, built a fire line (which means removing all vegetation from an area that is at least several feet wide), and then worked to keep the fire from crossing that line. Firefighters still build firelines today, but, he observes, they typically do it “miles (in places 10 or more) from the actual fire.”

That has been my observation as well, and I believe the change came about as a result of Colorado’s South Canyon Fire, in which fourteen firefighters who were engaged in direct attack were killed in what is known as a “burnover.” Basically, the fire jumped across the firelines and surrounded them. Continue reading

The Housing Bubble Continues to Inflate

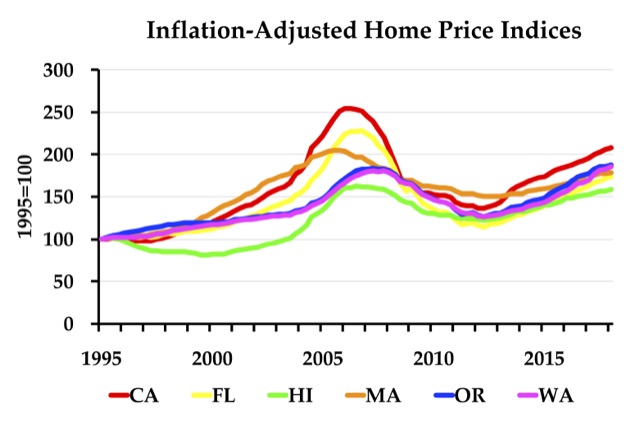
Housing prices in Washington state grew by nearly 10 percent in the last year, more than in any other state in the country. Other states with rapid price growth include Arizona (7.1%), California (6.3%), Colorado (8.0%), Florida (7.3%), Idaho (8.6%), Nevada (9.3%), Oregon (6.8%), Texas (6.3%), and Utah (8.0%). These numbers compare average prices from April 2017 through March 2018 with averages from April 2016 through March 2017 from the Federal Housing Finance Agency’s home price index dataset, specifically the state quarterly all-transactions index.

After adjusting for inflation, prices in Colorado, DC, Montana, North Dakota, Nebraska, Oklahoma, Oregon, South Dakota, Tennessee, Texas, Utah, and Washington are higher today than they were at the peak of the mid-2000s housing bubble, but price increases show no real sign of slowing down. Inflation-adjusted prices grew faster in the last year than they did the year before in 36 out of 50 states (as well as DC), and they declined in only one state, North Dakota. Continue reading

Waymo Gearing Up

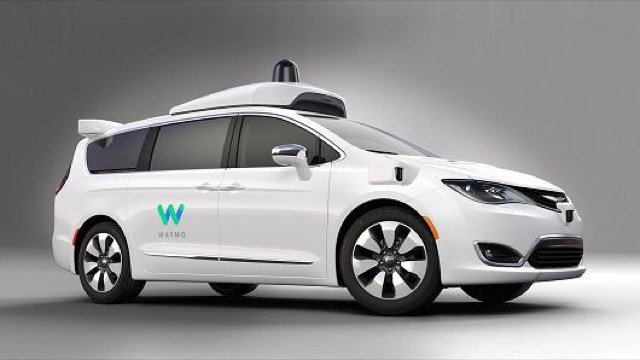
Waymo will order up to 62,000 plug-in hybrid minivans from Chrysler for its driverless ride-hailing service. Waymo already has 600 such minivans that it is testing in Austin, Phoenix, and the San Francisco Bay Area.

The 62,000 Chryslers are on top of the 20,000 electric cars that Waymo announced in March that it was planning to buy from Jaguar. Waymo says it expects to have all of these vehicles fully deployed by 2022 at the latest. Continue reading

More Costly and Later Than Ever

The head of California’s High-Speed Rail Authority, Brian Kelly, says that the train will take longer to build and be more expensive than anyone ever thought. He almost says it like those are good things. The authority plans to publish its latest cost and construction estimates next week.

The authority recently admitted that the first section of the project, which was supposed to cost $6 billion, is now expected to cost $10.6 billion. That’s the cheapest segment of the line because it is flat Central Valley of the state. Getting from there over the mountains to Los Angeles and the San Francisco Bay Area will require expensive tunneling at both ends, including a 13.5-mile tunnel that is expected to cost anywhere from $5.6 billion to $14.4 billion.

The total cost of a truly high-speed line all the way from L.A. to San Francisco is almost certainly going to be more than $100 billion, and it won’t be complete until sometime in the 2030s at the earliest. A representative of the airline industry pointed out that, for just $2 billion and eighteen months, the state could start a high-capacity airline service between the two cities — and sell the planes if it doesn’t work out. Though rail proponents say that downtown-to-downtown train times will be comparable to flying, the Los Angeles area has five airports and Bay Area has four, so far more people live near one of those airports than to downtowns. Continue reading

A City in Egypt

In a state of the city address last week, the mayor of Cupertino, Darcy Paul, said that the housing shortage in his city was “not dire” and recommended against approval of a planned mixed-use housing project to replace a former shopping mall called Vallco. Developers wanted to convert the 1.2-million-square-foot mall into 2,400 units of housing along with some retail and offices. Paul thought the retail and offices were fine, but opposed the housing.

Just how dire is Cupertino’s housing shortage? The median home value, according to Zillow, is $2.158 million. The median family income is $158,000. That’s a value-to-income ratio of 13.7. Palo Alto’s is higher ($3.01 million to $167,440 for a value-to-income ratio of 18), but I’d still say that Cupertino’s housing market is pretty dire considering that fifty years ago the value-to-income ratios in the Bay Area were less than 2.5.

Paul is being rightly criticized for his insensitivity to the housing problems faced by newcomers who earn $158,000 a year. But the truth is that almost everyone in Cupertino, Palo Alto, and the rest of Santa Clara County are suffering from a blind spot–more of a blind mountain–when it comes to housing issues. Continue reading

State of the Union’s Infrastructure

Remember America’s crumbling infrastructure that supposedly needs trillions of dollars for maintenance and rehabilitation? President Trump doesn’t. Instead, the seven sentences in his state of the union speech that focused on infrastructure talked about building “gleaming new” projects rather than fixing existing systems.

The only real news is that he is upping the ante from $1.0 trillion to “at least $1.5 trillion.” More disturbingly, other than mentioning an “infrastructure deficit” — which could just as easily be interpreted to mean a shortage of new infrastructure as a deficit in maintenance — Trump said nothing about fixing existing infrastructure. Instead, he wants to “build gleaming new roads, bridges, highways, railways, and waterways.”

Why? We have plenty of railways. Though the railroads have trimmed the nation’s rail mileage by 45 percent since 1916, they move more freight than ever and seem to be quite capable of adding capacity where they need it without government help. High-speed trains, meanwhile, are pointless when we have planes that can go twice as fast and don’t require hundreds of billions of dollars of supporting infrastructure. Continue reading

Transportation Energy Costs

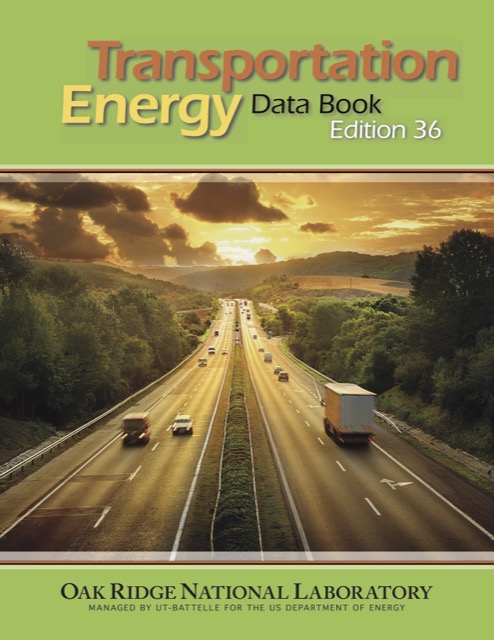
The average car on the road consumed 4,700 British thermal units (BTUs) per vehicle mile in 2015, which is almost a 50 percent reduction from 1973, when Americans drove some of the gas-guzzliest cars in history. The average light truck (meaning pick ups, full-sized vans, and SUVs) used about 6,250 BTUs per vehicle mile in 2015, which is also about half what it was in the early 1970s.

Click on the above image to download a 10.2-MB PDF of the above report. Use links below to download spreadsheets or individual chapters from the report.

By comparison, the average transit bus used 15 percent more BTUs per vehicle mile in 2015 than transit buses did in 1970. Since bus occupancies have declined, BTUs per passenger mile have risen by 63 percent since 1970. While buses once used only about half as much energy per passenger mile as cars, they now use about a third more. Continue reading