
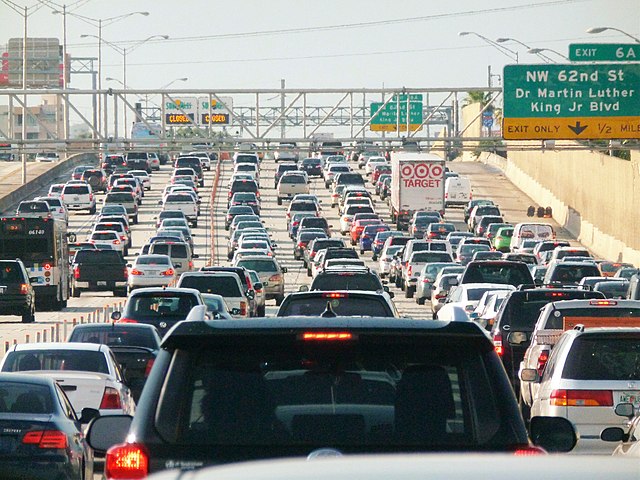
A recent op-ed in the Baltimore Sun written by several elected officials proposes to “re-imagine public transit” in the Baltimore area. In particular, they want to revive the Red Line, a light-rail line that was cancelled in 2015. Among the strikes against it were that it would increase congestion and would carry so few passengers that, under FTA rules at the time, it wasn’t cost-effective and therefore wasn’t eligible for federal funding. (The rules have since been changed, but that doesn’t make it any more cost effective.)
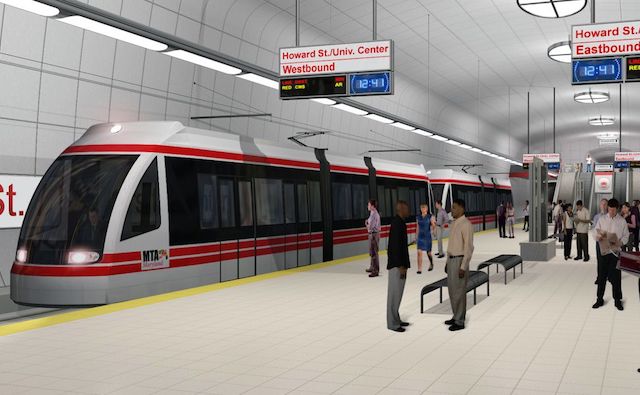
Imagining the Baltimore Red Line.
The fact that Maryland’s governor approved the DC-area Purple Line at the same time as he cancelled the Red Line has stuck in the craw of Baltimore transit officials. Since then, the Purple Line has suffered numerous delays and cost overruns, but that doesn’t worry Baltimore’s mayor and the county executives who wrote this op-ed. Heck, they probably see cost overruns as a good thing as they would bring more money into their communities. Continue reading


