The Value of Single-Family Neighborhoods

The YIMBY movement argues that people who oppose densification of their single-family neighborhoods are racist. But race has nothing to do with it. A new paper by Wharton economist Joseph Gyourko and Brown University economist Sean McCulloch finds that a 1/2-unit per acre increase in density imposes a loss of $9,500 per home in single-family neighborhoods. Moreover, the loss is significantly larger if the increase density is in the form of multifamily housing or rental housing.

What Gyourko and McCulloch really found is that people are willing to pay more to live in low-density neighborhoods, and their willingness to pay for a home drops when the neighborhood is densified. This means densification is effectively a taking of private property, which the Fifth Amendment to the U.S. Constitution suggests should require compensation. Continue reading


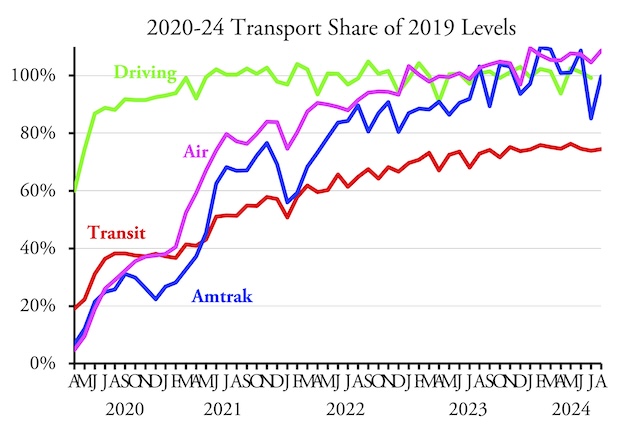
August Driving Nearly 103% of Pre-Pandemic Miles

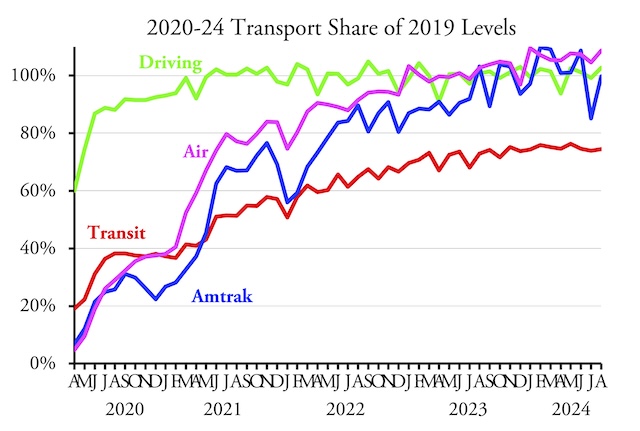
Americans drove 102.7 percent as many miles in August of 2024 as in the same month of 2019, according to data released yesterday by the Federal Highway Administration. Moreover, this is the first month I can remember since the pandemic began that driving exceeded pre-pandemic numbers on all types of roads, including urban and rural interstates, other arterials, and other roads.

For a discussion of Amtrak and airline data, see this post. For a discussion of transit data, see this post.

August 2024 driving was greater than 2019 driving in 28 states, while it was less in 22 states plus DC. DC driving was slightly less than 80 percent of 2019 miles, and miles of driving were also particularly low in Delaware (82%), Hawaii (84%), West Virginia (86%), and Massachusetts (88%). Continue reading

Lower Fares, Higher Operating Costs

Transit agencies carried 18 percent more riders in 2023 than 2022, but 29 percent fewer than in 2019. Average trip lengths declined from 5.5 miles in 2019 to 5.0 miles in 2023, probably because commuter rail and commuter buses, which tend to carry riders the longest distances, did particularly poorly. Overall transit carried 35 percent fewer passenger-miles in 2023 than in 2019. These data are based on the National Transit Database and in particular the 2023 database that the Federal Transit Administration released last week.

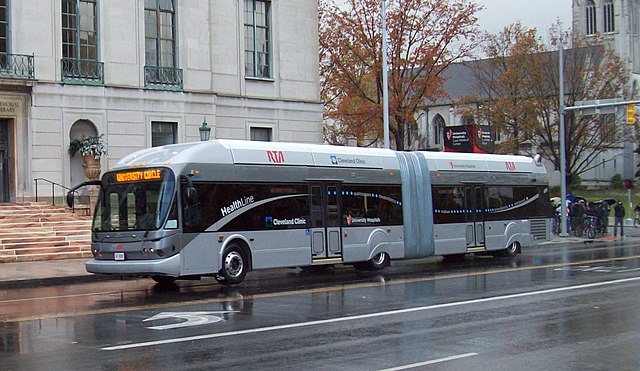
A bus-rapid transit line has generated lots of positive publicity for Cleveland transit, but the truth is that Cleveland has one of the worst-performing transit systems in the country, with ridership falling 35 percent between 2014 and 2019 and another 30 percent between 2019 and 2023. Photo by GoddardRocket.

Fares were proportional to passenger-miles being 35 percent less than in 2019, while operating costs were 22 percent greater. The result was that the operating subsidy per rider, at $7.26, was more than twice 2019’s, which was $3.51 and only a slight improvement over 2022’s operating subsidy of $7.59 per rider. Operating subsidies per passenger-mile grew from 64ยข in 2019 to $1.51 in 2022, declining only slightly to $1.45 in 2023. Continue reading

Baltimore’s Red Line: Insane or Idiotic?

Maryland transportation planners are considering spending a breathtaking $9 billion to build a 14-mile light-rail line that would never come close to carrying the 33,000 to 35,500 daily passengers they claim. This $640-million-per-mile cost would be incurred if they built the line in a tunnel.

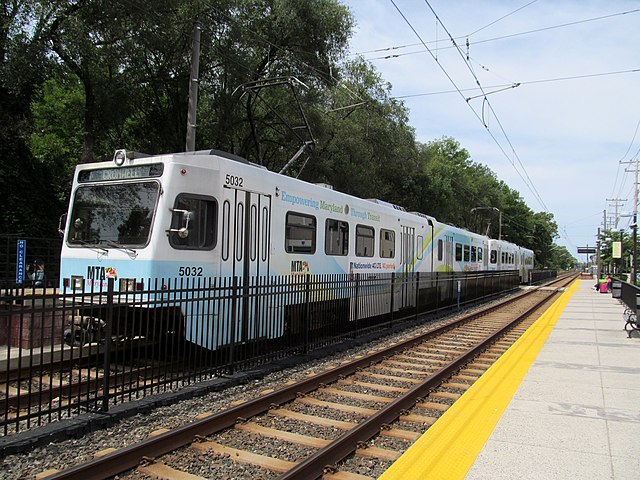
Although Baltimore’s light-rail system is capable of accommodating three-car trains, two cars are more common simply because ridership is so low. Photo by Pi.1415926535.

The alternative would be to build it on the surface, which is still projected to cost around $5 billion, or more than $350 million a mile. Back in 1990, before Congress began spending billions of dollars on transit capital improvements, $50 million a mile was considered outrageously expensive for light rail. Now $350 million a mile is just routine. Continue reading

Abolish the Electoral College

Since it appears increasingly likely that the winner of the popular vote for president will not win the election, we are already seeing calls to “dump the electoral college.” Predictably, since the Democrat is the candidate who is likely to win the vote but lose the election, these calls are coming from Democrat supporters, while conservatives are supporting of the status quo. But if the situation were reversed — if the Republican were winning the popular vote but losing the election — I’m certain we would be hearing conservatives say we need to abolish the electoral college.

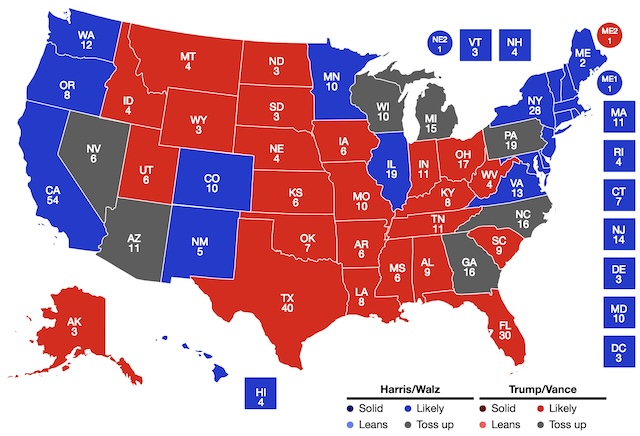
Seven states are currently undecided, so those are the states where candidates are doing most of their campaigning. Source: Real Clear Polling.

I want to abolish the electoral college not because of how it would change the outcome of this particular election but because of how it would change democracy. The United States is known for its low voter turnouts, and a large part of that is because many people don’t believe their vote counts. When it comes to the presidential election, those people are absolutely right unless they live in one of the “battleground states,” which this year are Arizona, Georgia, Michigan, Nevada, North Carolina, Pennsylvania, and Wisconsin. Because presidential politics get more media attention than, say, gubernatorial or legislative politics, people who don’t think their vote for president counts are also less likely to vote in other elections. Continue reading

Housing Data for 2023

The median owner-occupied home was worth $340,000 in 2023, which was 3.5 times median family incomes, according to 2023 American Community Survey data recently released by the Census Bureau. While a value-to-income ratio of 3.5 is still quite affordable, it isn’t as affordable as the 3.0 ratio in 2019. The difference is probably mainly due to supply-chain problems and labor shortages since the pandemic.

More than 6 million single-family homes were added to the nation’s housing stock between 2019 and 2023.

Despite the increase in housing costs relative to incomes, homeownership grew from 64.1 percent in 2019 to 65.2 percent in 2023. Moreover, despite densification programs in many major cities, the population of people living in single-family homes grew from 73.6 percent in 2019 to 74.3 percent in 2023. Continue reading

Charlotte Wants to Tax Low-Income Families to Give High-Income Workers Fancy Transit Rides

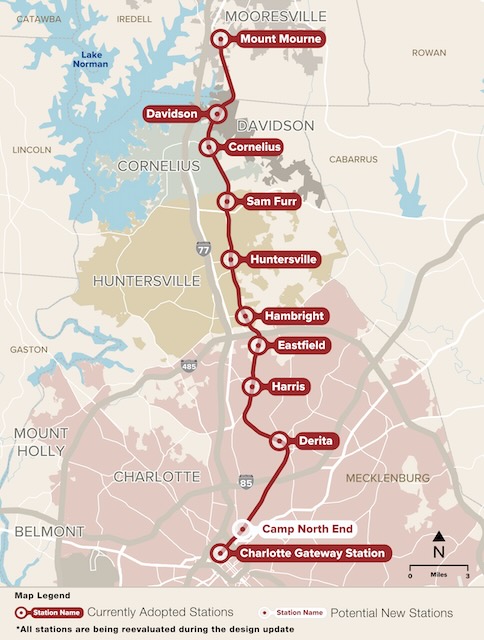
In 2012, the Charlotte Area Transit System (CATS) proposed to operate commuter trains between uptown Charlotte and the suburb of Mount Mourne. In 2011, it predicted (based on 2009 prices) that start-up costs for the 25-mile Red Line route would be about $452 million, slightly more than the cost of Charlotte’s first light-rail line (which was $444 million). While the commuter-rail route was almost three times as long as Charlotte’s first light-rail line, it was projected to carry fewer than a third as many riders: 5,600 per day as opposed to 18,100 per day.

Map of proposed Red Line commuter train.

Due to the high cost and small number of riders, the Federal Transit Administration refused to provide any federal funding for the project. At the time, the FTA’s cost-effectiveness rule limited federal funding to projects that cost less than about $25 per hour saved by transportation users, and the commuter train wasn’t projected to save enough hours to get the cost below this threshold. Continue reading

Transit’s Ride into Irrelevance

Just 3.5 percent of American workers commuted to work by public transit in 2023, according to American Community Survey data recently released by the Census Bureau. That’s down from 5.0 percent in 2019. Since transit ridership so far in 2024 is only about 4 percent more (when measured as a share of 2019 numbers) than it was in 2023, the 3.5 percent number is not likely to improve much in the future.

The increase in remote working has permanently shifted transportation patterns and particularly devastated transit ridership.

According to the survey data, the share of people working at home in 2023 was 13.8 percent, down from 15.2 percent in 2022 but up from just 5.7 percent in 2019. As I’ve noted before, the increase in remote working has a double impact on transit ridership. First, the downtown workers who were transit’s main customers before the pandemic are more likely to work at home than many other people. Second, the reduction in congestion resulting from increased remote working will lead some people who were avoiding congestion by riding transit to return to driving. Continue reading

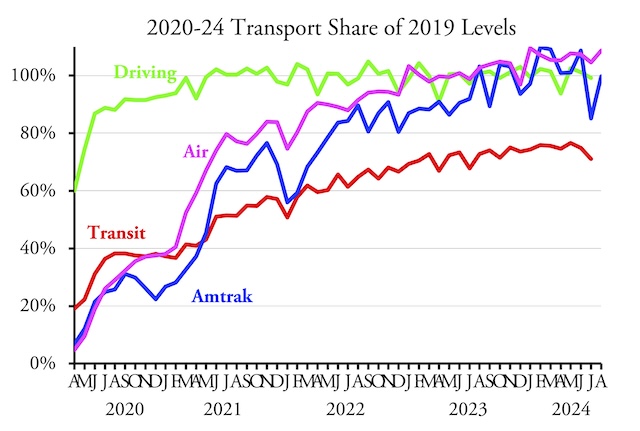
August Transit Ridership 74.5% of 2019

America’s transit systems carried 25.5 percent fewer riders in August of 2024 as in the same month of 2019, according to data released by the Federal Transit Administration last Friday. Transit ridership has hovered around 75 percent of pre-pandemic levels since November 2023.

I previously reported that July transit ridership was only 71.1 percent of 2019, but warned that several major transit agencies had not yet submitted July numbers. Those agencies, I estimated, made up about 2.5 percent of U.S. transit ridership so I guessed that the real number would be 73.6 percent. I was off by a bit: all major agencies have report July numbers and July ridership was 73.9 percent of 2019. Continue reading

Amtrak Recovers to 99.7% of Pre-Pandemic PMs

Amtrak carried 99.7 percent as many passenger-miles in August 2024 as in the same month of 2019, according to the state-owned company’s monthly performance report. This was up from 85.1 percent in July. While Amtrak was still slightly short of pre-pandemic levels, domestic airline flights comfortably carried 8.7 percent more passengers in August 2024 than in 2019, according to TSA passenger counts.

The Department of Transportation has not yet posted August highway or transit data but when it does the results will be reported here.

While Amtrak numbers are in passenger-miles (which is the preferred measure) and airline numbers are in passenger counts, data from the Bureau of Transportation Statistics show that these follow one another fairly closely. In June, the most recent month for which such data are available, domestic flights carried 6.8 percent more passenger-miles than in June 2019. Continue reading