The Libertarian Case for Single-Family Homes

After spending more than 25 years opposing central planners who want to densify cities, I’ve been dismayed to find I also have to oppose people who claim to support free markets who want to abolish single-family zoning. I’ve made the best case I can for single-family housing in an article in Liberty Unbound, the on-line version of what was once Liberty magazine.

My argument is simple. Around 80 percent of Americans want to live in single-family homes, but most urban planners think that well over 20 percent — some plans even call for more than 50 percent — should live in apartments. Any policy that reduces the supply of single-family homes in order to increase the supply of apartments therefore supports the goals of the central planners, and true libertarians should oppose such policies as they undermine consumer preferences. Continue reading

Saving the World from Lithium Mines

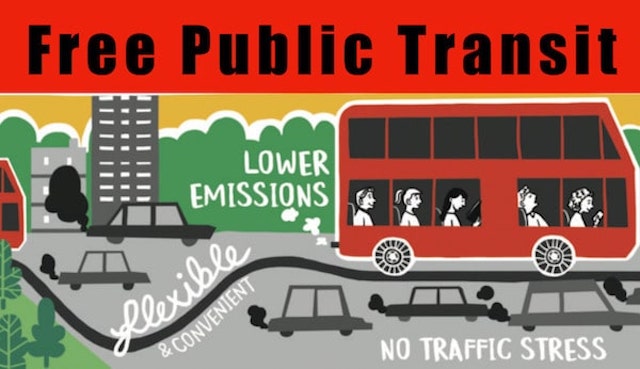
We can’t replace petroleum-fueled motor vehicles with ones powered by electricity, according to a new report, because mining enough lithium to power the batteries for those electric vehicles will destroy the world. Or part of it, anyway. The only solution, says the report, is for countries like the United States to replace private vehicles with public transit.

The only way to prevent this, according to a group called the Climate and Community Project, is to ban cars.

Why is it that, no matter what the problem, leftists think the only solution is to ban cars and spend more money on mass transit? According to a sociologist I once knew named John Finley Scott — who is better known for having created one of the first mountain bikes than his sociological research — most auto opponents are people who didn’t learn to drive until their late 20s or later, by which time they knew they were mortal and found driving to be terrifying. They can’t imagine anyone actually liking cars or driving, so they see nothing wrong with ridding the earth of such an evil invention. Continue reading

Stressing Out Over CO2

Emissions of carbon dioxide in the United States peaked in 2007 at 6.14 billion tons. Since then it declined, initially due to the 2008 recession but later to use of more efficient fuels (mainly natural gas instead of coal). By 2019, it had declined by 0.76 billion tons, or 12 percent, while in 2021 it had fallen another 0.37 billion tons, or 18 percent less than 2007. Some of the decline in 2021 was due to COVID, but some was due to continuing efficiencies.

Source: Our World in Data.

Over the same time period, 2007 to 2021, emissions in China grew by 4.49 billion tons, or almost four times the decline in the United States. As of 2021, China was producing almost two-and-a-half times as much carbon emissions as the United States. Much of the increase in China was due to burning of coal that we and other countries that are busy reducing their carbon footprints are exporting to China. Continue reading

No More Car Ownership?

When I heard that the World Economic Forum proposed to ban car ownership, I dismissed it as left-wing nonsense that would never get far with elected officials. But earlier this week the Scottish government announced it planned to ban car ownership as a part of its campaign to reduce per-capita driving by 20 percent by 2030.

Of course, they say such actions are needed to reduce climate change, but the truth is that a lot of people have hated automobiles for decades and are just using climate change as an excuse to carry out their vendetta against personal mobility. They also claim to care about income inequality, but the automobile did more to reduce income inequality in the 20th century than just about anything else. Continue reading

November Driving 1.5% More Than in 11/2019

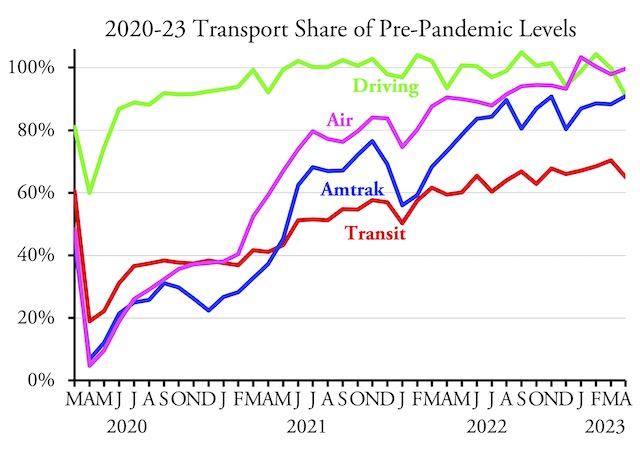
Americans drove 1.5 percent more miles in November 2022 than November 2019, according to data released by the Federal Highway Administration yesterday. This is the third month in a row that driving exceeded 100 percent of pre-pandemic levels. For the year to date, Americans drove 99.99 percent as many miles as in 2019, so if December is even just 0.2 percent above 100 percent, the year as a whole will be as well.

States where driving was well ahead of 2019 include South Dakota (20%), Florida, Missouri, and Rhode Island (all 14%), and Hawaii (12%). Hawaii is surprising as much driving there is by tourists, and the tourist industry has been decimated by the pandemic. Apparently, it is recovering. States where driving remains short of 2019 include West Virginia (-22%), California (-13%), Minnesota (-9%), and New Jersey (-8%), as well as the District of Columbia (-14%). Continue reading

Fabricating Reality with ChatGPT

Last month, a non-profit group called OpenAI made available an artificial intelligence program called ChatGPT that has educators worried that students will use it to write fake essays. ChatGPT relies on information it can find on the World Wide Web up through the end of 2021 and is able to converse on a wide range of subjects.

When it first came out, I was doing research on the history of steam locomotive technology for my other blog, Streamliner Memories. I asked it some questions that I already knew the answers to and it made some reasonably intelligent replies. Continue reading

Amtrak November PM 91% of November 2019

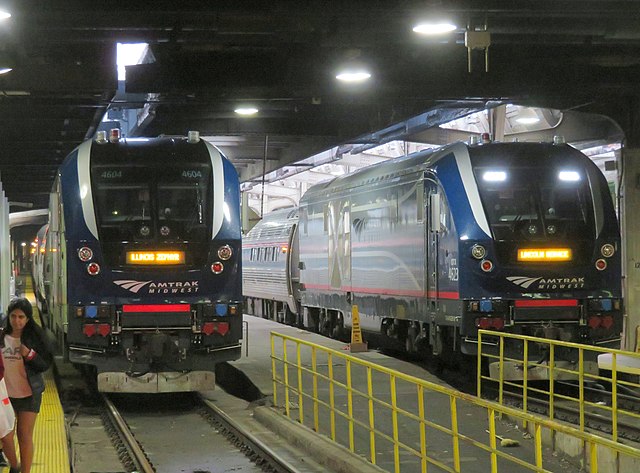
Amtrak carried 90.8 percent as many passenger-miles in November 2022 as it did in November 2019, according to the monthly performance report released by the company last week. This is the first time since the pandemic that it has exceeded 90 percent of pre-pandemic numbers.

Amtrak remains behind air travel, which first breached 90 percent in April 2021. Yet it appears that Amtrak, unlike transit, will eventually come pretty close to 100 percent of pre-pandemic numbers. Continue reading

Bandon Is Urban After All

Last week, I complained that, under the Census Bureau’s new definition of “urban,” Bandon, Oregon is rural. It turns out that it squeaked into the list of urban areas by virtue of having 2,012 housing units. (My count of housing units was based on the Census Bureau’s 2018 estimates.)

This large shopping center in California City, California isn’t enough for the Census Bureau to classify it as “urban.”

However, 1,143 areas that had been classified as urban in 2010 were counted as rural in 2020. To be urban, an area had to have either 5,000 people or 2,000 housing units and an urban core that had at least 1,275 housing units per square mile. Continue reading

Steve McCarthy R.I.P.

My first real job was a summer internship with the Oregon Student Public Interest Research Group (OSPIRG) in 1972. Steve McCarthy was the flamboyant director of OSPIRG, and my work that summer on low-cost ways to improve TriMet, Portland’s transit system, helped propel him into the job of TriMet’s general manager. He implemented some of my suggestions and made other improvements and by the end of the decade Portland was one of the few urban areas in America where transit ridership had grown faster than driving.

Steve McCarthy growing pears in bottles that will soon be filled with Clear Creek pear brandy. Photo courtesy of Clear Creek Distillery.

Nearly two decades later, Steve invited me out to lunch in Northwest Portland where he had started a new business making pear brandy. Over lunch, he told me that after leaving TriMet he took over his father’s business making hunting accessories and then bought a pear orchard in Oregon’s Hood River Valley, where his family had been in the fruit-growing business since 1910. He wanted to prove to other orchardists that they could make more money by adding value to their fruit than by just selling fruit to grocers. Continue reading

The Most Congested Cities

The most congested urban area in America in 2022 was Chicago, where the average auto commuter lost 155 hours to traffic delays. That was only one hour less than London, the most congested urban area in the world, or at least the most congested city evaluated in the latest INRIX global traffic scorecard.

Prior to the pandemic, more than half the people who worked in downtown Chicago took transit to work, but the city was still very congested and — according to INRIX — is even more congested today. Photo by Michael Kappel.

The second-most congested U.S. urban area was Boston, with 134 hours of delay per driver, followed by New York at 117 hours. Los Angeles, which has often been at the top of the list, was way down in 2022, suffering 95 hours of delay per driver, and was edged out by San Francisco at 97 hours. Miami and Philadelphia were between New York and San Francisco. Continue reading