The Future of Urban Work

Between 40 and 50 percent of workers in 13 American cities telecommuted in 2021, according to the recently released American Community Survey (discussed here previously). The record is Fremont, California (outside of Oakland), where 48.9 percent telecommuted. More notable, three — possibly four, depending on how you count* — of the 13 cities are central cities, including San Francisco, Seattle, and Washington.

CityStateTelecommuters2021 JobsChange from 2019Change in Transit CommutersChange in Drive Alone Commuting
FremontCA48.9%112,50824,873-81.6%-17.9%
ArlingtonVA48.8%142,653-6,747-79.2%-34.2%
WashingtonDC48.3%353,845-32,033-68.8%-28.9%
BellevueWA48.1%74,006-6,368-80.3%-37.5%
SunnyvaleCA47.1%81,435-3,936-68.0%-45.9%
SeattleWA46.8%438,357-23,131-75.8%-30.8%
BerkeleyCA46.5%57,877-3,989-84.4%-16.5%
San FranciscoCA45.6%438,886-87,136-73.9%-22.8%
CambridgeMA44.4%70,450-816-58.9%-31.4%
CaryNC44.2%91,3932,32037.3%-34.2%
NewtonMA43.9%45,504-579-68.9%-36.0%
BoulderCO42.6%55,376-3,192-72.5%-28.9%
Santa ClaraCA40.2%68,880-6,756-80.1%-42.9%

Most of these 13 cities saw 70 percent or more declines in transit commuters since 2019. The major exception was Cary, North Carolina. However, the survey numbers for Cary are questionable. Transit’s share of Cary workers went from 0.3 to 0.4 percent. Because these numbers are so small, the margins of error are large. The Census Bureau reported 295 plus or minus 233 transit commuters in 2019 and 405 plus or minus 348 in 2021. Since the error terms overlap, the change from 2019 to 2021 isn’t statistically significant. Continue reading

Is Wall Street Making Housing Unaffordable?

“Wall Street is snapping up [single-] family homes,” reports the Economist. This isn’t exactly news. A year ago, CNN reported the same thing. Two years ago, the New York Times reported a “$60 billion housing grab by Wall Street.” Three years ago, the Atlantic announced that “Wall Street is your landlord.”

Wall Street’s or your street? Photo by isipeoria.

These articles are often accompanied by an implicit accusation that Wall Street speculators are responsible for housing becoming unaffordable. Sometimes the accusation is more explicit. A year ago, Tucker Carlson claimed that the “phenomenon of skyrocketing house prices is being driven by Wall Street outbidding normal Americans trying to buy homes.” Earlier this week, HousingWire.com claimed that “Institutional purchases are . . . making houses less affordable.” Continue reading

Pandemic Increases Homeownership

The nation’s number of occupied homes grew by 3.9 percent between 2019 and 2021, representing 4.7 million units of new homes, according to table B25032 of the American Community Survey. More than 98.5 percent of those new units were owner occupied, while rental housing grew by just 0.2 percent or less than 1.5 percent of total new homes.

More than three-fourths of new homes were single-family detached homes, reflecting the preferences of most (about 80 percent) Americans for such homes. Another 16 percent were single-family attached (row houses), while only 12 percent were multifamily. Continue reading

July Driving Falls to 97% of Pre-Pandemic Levels

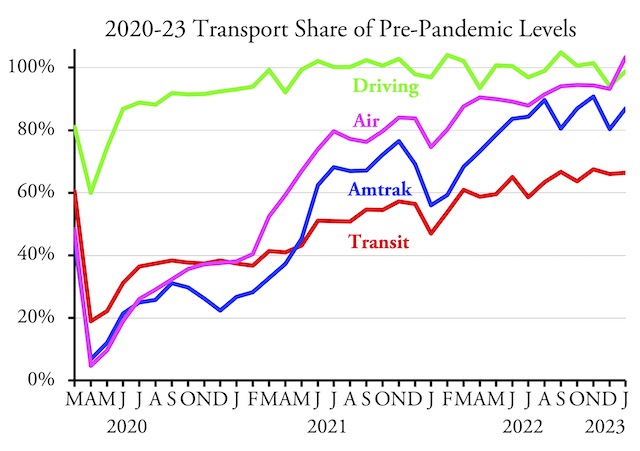
Americans drove 97 percent as many miles in July 2022 as they had in July 2019, the year before the pandemic, according to data released yesterday by the Federal Highway Administration. This is only the fourth month out of the last fourteen in which driving was less than 100 percent of pre-pandemic levels.

See this post for sources of data for Amtrak, air travel, and transit.

The dip in driving in April was explainable by the spike in fuel prices caused by the war in Ukraine. Prices actually peaked in mid-June and have declined almost every day since, so it isn’t clear why driving declined a bit in July. Continue reading

Population and Housing in 2021

The 2021 American Community Survey confirms that major population shifts took place due to the pandemic. But those shifts aren’t necessarily reflected by declines in housing prices in cities and regions that lost population. Indeed, prices rose almost everywhere, and usually faster than incomes.

Americans are moving out of big cities to smaller towns and the suburbs, but so far this hasn’t made big-city housing more affordable.

Numerically, the big loser between 2019 and 2021 was California, which saw the net departure of almost 275,000 people. That was just 0.7 percent of the state’s population, but the only state that lost a greater percentage was Mississippi. Other states that lost residents were Arizona, Louisiana, and West Virginia, plus the District of Columbia lost more than 25,000 people, or more than 5 percent of its population. Continue reading

Census Data Show Transit’s Devastation

More than three times as many people worked at home in 2021 as in 2019, according to data that was released yesterday by the Census Bureau. While this isn’t surprising, the increase in telecommuting had an outsized impact on transit commuting, which declined by more than 50 percent. For comparison, the number of people driving alone to work declined by only 12 percent.

These numbers are from the American Community Survey, a questionnaire that the Census Bureau has sent to about 3.5 million households each year since 2005. Due to the pandemic, the Census Bureau did not do a complete survey in 2020. However, 2021 data are directly comparable to 2019 numbers to get an indication of changes due to the pandemic.

The survey produces more than 1,500 tables about population, race, incomes, housing, commuting, education, and other information. Today, I’ll focus on tables B08103, “Means of Transportation to Work,” B08119, “Means of Transportation to Work by Workers’ Earnings in the Past 12 Months,” B08141, “Means of Transportation to Work by Vehicles in Household,” and B25044, “Tenure by Vehicles in Household.” I’ll write about other tables in future posts. Continue reading

Land-Use Planning in a Fire Plain

Fed by high winds, a wildfire about 50 miles from Antiplanner headquarters in Camp Sherman blew up on Sunday, burning 34,000 acres in a few hours. Meanwhile, Oregon’s Land Conservation & Development Commission (LCDC) is seeking comments on a report it has prepared on “wildfire adapted communities.”

Click image to download a copy of this report (2.9-MB).

The report says little about density other than to suggest that structures be clustered “in areas of lowest risk.” Since the only places in Oregon that are naturally at low risk of wildfire are underwater, this suggests that no “clustering” of development makes sense. Continue reading

Scrutinizing July Transit Data

The Antiplanner is back from Wheeler County where I happened to meet some Portland transportation consultants who were cycling through the area. If you are reading this, I hope you had a good trip with no more mechanical problems.

I promised I would take a closer look at the transit data that the FTA released last week. The data continue to show that rail transit is lagging behind bus ridership, with rail at 57 percent and bus at 61 percent of pre-pandemic levels. Yet worst off is commuter bus, at a mere 36 percent of July 2019 numbers. Rapid bus is 64 percent, and hybrid rail is at 82 percent — though that’s because a new line opened in North San Diego County since the pandemic began. Continue reading

July Transit Ridership Falls Below 60% of 2019

U.S. transit systems carried 58.7 percent as many riders in July 2022 as they did in July 2019, according to data released by the Federal Transit Administration yesterday. This is a major setback from June’s 65.0 percent of June 2019. Of course, the increase in June was due to high gas prices and the decline in July was due to falling gas prices.

Amtrak numbers are from its July performance report. Air travel numbers are based on TSA passenger counts. Highway numbers should be available in a week or so.

Amtrak, meanwhile, has pushed up from 83.6 to 84.3 percent while air travel dropped from 89.1 to 87.9 percent of pre-pandemic levels. The air travel numbers include both domestic and international travel; domestic travel numbers for July aren’t available yet, but the last numbers that were available, for April, stood at 97.2 percent of pre-pandemic levels. Continue reading

Minnesota’s Embarrassing Licensing Board

The Antiplanner disagrees with Charles Marohn, of Strong Towns fame, about a lot of things. But I agree with him that the Minnesota Board of AELSLAGID (that’s Architecture, Engineering, Land Surveying, Landscape Architecture, Geoscience and Interior Design, in case it isn’t obvious) was wrong to fine him $1,500 and censure him for being late in renewing his license as a professional engineer.

Charles Marohn in 2016. Photo by SEAGreenways.

Marohn is trained as a professional engineer and started practicing, with a Minnesota license, in 2000. Though he stopped practicing in 2012 to form Strong Towns, he kept his license up and continued to call himself an engineer on his resume. However, he moved his residence in 2018 and forgot to notify AELSLAGID, so when they sent him a renewal notice he didn’t get it. He eventually renewed, paying a $120 late fee. Continue reading