Transit’s Zombie Future

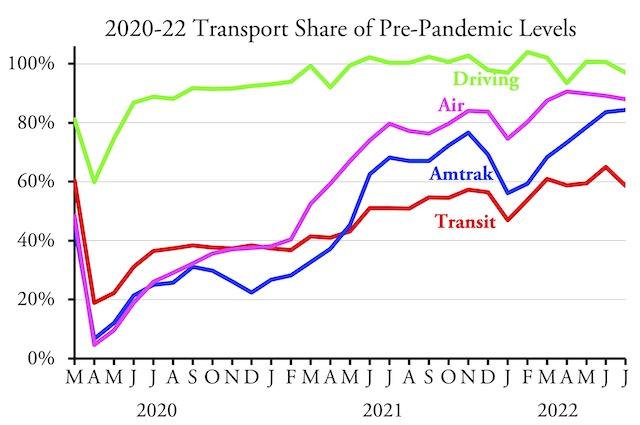
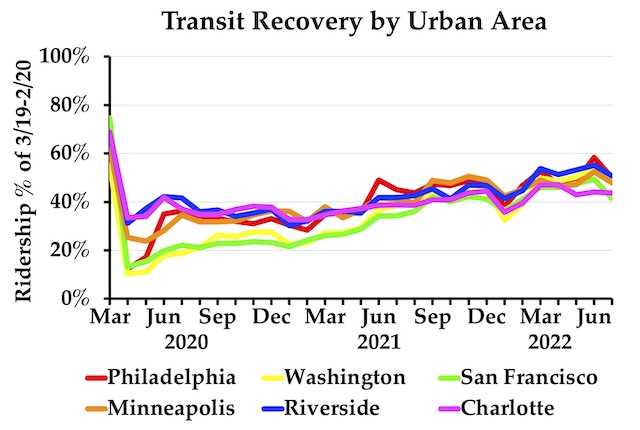
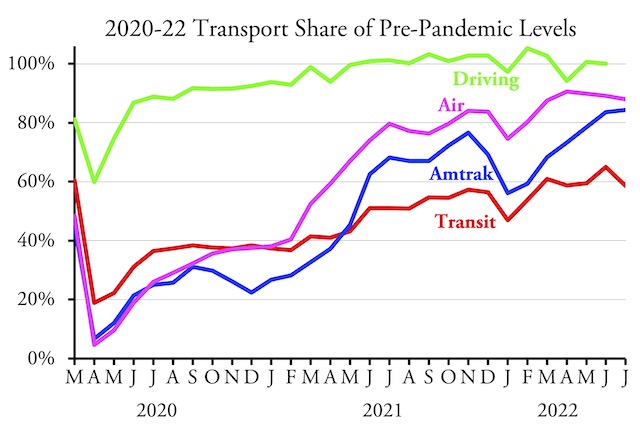
March transit ridership pushed up above 60 percent of pre-pandemic numbers for the first time since the pandemic began, according to data released by the Federal Transit Administration last week. Ridership was boosted by the fact that March 2022 had two more weekdays than March 2019. Since April 2022 has one fewer weekday than April 2019, ridership is likely to dip back down below 60 percent in April.

Click image to download a four-page PDF of this policy brief.

Transit is still lagging well behind other modes of travel. Amtrak carried 68 percent as many passenger-miles as in March 2019 while the airlines carried 88 percent. Domestic air travel was probably above 90 percent, but data sorting domestic from international travel won’t be available for a couple of months. Miles of driving in March will be available in about a week but are likely to be more than 100 percent of March 2019 miles.

Continue reading

LA Metro Celebrates Losing 138 Million Bus Riders

Los Angeles Metro recently celebrated the tenth anniversary of the opening of its Expo light-rail line. Construction on the line began in 2006, a year in which LA Metro buses carried 409 million trips, and the line opened in April, 2012.

The LA Expo line shortly after it opened. Photo by Gary Leonard for Los Angeles Metro.

To help pay for the Expo and other new light-rail lines, LA Metro cut bus service by nearly a quarter between 2006 and 2019. This contributed to the loss of a third of its bus riders, or nearly 138 million trips per year. The Expo line, meanwhile, boosted light-rail ridership by about 2 million annual trips, enough to make up 1.5 percent of the loss in bus ridership. Continue reading

Who Rules Transit?

Although 60 percent of transit riders are people of color, says New York’s TransitCenter, 66 percent of transit agency leaders and managers are white. The organization sees this “gulf between ‘who decides’ and ‘who rides'” as a major problem.

Click image to download a 5.2-MB PDF of this report.

The TransitCenter is a well-intentioned organization whose thorough reports on transit issues are generally skewed by the fact that the group is located in the one American city that heavily relies on transit. In keeping with social justice rhetoric, this particular report views transit as a racial issue, whereas I view it as a class issue, namely a gulf between the middle class (people with college educations) and working class. Continue reading

Electric Ride Lab Gets Everything Wrong

Someone named Chris Wilson has asked me to plug a “thorough and in-depth article about the 5 main reasons why public transportation in the US is so bad.” He and his associates at Electric Ride Lab–which promotes personal electric transportation such as e-bikes, e-scooters, and e-skateboards–“took the time to thoroughly research and include a ton of information” in the article.

If you have an electric bike or scooter, why do you need transit anyway? Photo by Ian Sane.

They should have done a little more research as just about everything they say about transit is wrong. Here are Wilson’s five wrong reasons why public transit is so bad in the United States. Continue reading

America’s Two Housing Markets

Imagine that, on top of all our other problems, the United States had a shortage of pickup trucks. While many pickups are purchased for recreational purposes, they also play vital roles in construction, farming, forestry, and other industries. The impacts of a shortage could reverberate throughout the economy.

Click image to download a three-page PDF of this policy brief.

A California politician says he has a solution to the pickup shortage: Simply buy old pickups, scrap them, and use the materials to build subcompact cars such as the Chevrolet Spark or Mitsubishi Mirage. Full-sized pickups typically weigh twice as much as subcompacts, so this program could flood the market with two or more vehicles for every one that is scrapped. That would have to reduce the price of pickups, wouldn’t it? Continue reading

Honolulu Rail: $9.9 Billion to Go Nowhere

The Honolulu Authority for Rapid Transportation (HART) now says it will cost $9.9 billion to not finish its rail project by 2031. As recently as a year ago, HART insisted it would be able to complete the project by 2031, a mere 12 years late. But now it admits that it has a $1.4 billion funding shortfall that will prevent completion.

The rail line was supposed to go from Kapolei, a community of 21,000 people known as Oahu’s “second city,” to Ala Moana Center, Hawaii’s largest shopping mall. Even now, HART’s website claims it is essential for the rail line to go to Ala Moana “because of the Ala Moana Transit Center, which is the City’s largest bus transit center.” Rail passengers would be able to transfer there to buses that could take them to Waikiki, the University of Hawaii, and other destinations. Continue reading

Why Not to Take the Bus

To commemorate Earth Day, Memphis television meteorologist John Bryant decided to try riding the bus to work. Normally, his home-to-work journey takes about 15 to 20 minutes. His effort to protect the environment ended up taking 2-1/2 hours. Part of the problem was his unfamiliarity with the bus system, but the fastest he might have been able to make it was at least 90 minutes, partly because he had to walk a half mile from his home to the nearest bus stop and another mile to work from the nearest bus stop to his office. The few other passengers riding the bus with him were mostly too poor to own an automobile.

Despite this, he concluded more people should ride the bus. “These are the kind of sacrifices right now that we need to think about doing, even if you only do it one time,” he said, both for “reducing our carbon footprint” and for “connecting on an emotional level with citizens [who couldn’t afford cars] in the city I grew up in.” Continue reading

Free Transit Boosts Ridership by 16 Percent, Maybe

Bloomberg reports that, when Utah Transit (UTA) eliminated transit fares on a trial basis in February, weekday ridership grew by 16 percent. Overall, the latest data show, average daily ridership was only 18 percent greater than it had been in January. That compares with 25 percent for the nation’s transit systems as a whole, suggesting that free transit may not have been the reason why ridership increased.

Utah Transit buses have an average of 36 seats but carried an average of just 5 passengers (that is, they carried 5.0 passenger-miles per vehicle mile) in 2019 and just 3.6 in 2020. Photo by Paul Kimo McGregor.

Considering that passenger fares brought more than $48 million into UTA’s budget in 2019, such a small boost in ridership hardly seems worth the loss of that revenue. Transit agencies, however, desperately need reasons to justify their heavily-subsidized existence. Offering free fares may boost ridership, if only by a small amount, but more important it insulates agencies from ridership fluctuations. If the agencies are solely dependent on taxpayers to keep their buses and trains running, then all they have to do is convince taxpayers or appropriators that transit is somehow vital to cities even if hardly anyone uses it. Continue reading

Americans Prefer Single-Family Neighborhoods

Many surveys have found that the vast majority of Americans, including Millennials, prefer or aspire to live in single-family homes. But surveys rarely ask whether they prefer that single-family home to be in a low-density neighborhood or if they would mind living next to a bunch of apartment buildings.

Would you want one to move next-door to your single-family home? This is real affordable housing, by the way: one of these condos is currently selling for $527 per square foot.

However, a polling firm called YouGov recently asked Americans whether they thought low-density neighborhoods were better than high-density ones. Specifically, they were asked whether low densities meant more or less congestion, more or less crime, and were better or worse for the environment. Planning advocates, of course, claim that high densities mean less congestion, are better for the environment, and have less crime because there are more “eyes on the street.” Continue reading

America’s Volatile Housing Markets

After adjusting for inflation, the nationwide median price of housing exceeded median prices during the 2006 housing bubble for the first time in early 2021, according to home price index data published by the Federal Housing Finance Agency. Zillow agrees: though Zillow says its price index is for the “typical” house rather than the median home, its inflation-adjusted price for single-family homes peaked in November 2006 at $295,000, then fell below $200,000 in 2012. The typical price then crept above $295,000 in December 2020. As of March 2022, it had grown to $338,000, an inflation-adjusted increase of 22 percent since the beginning of the pandemic.

Click image to download a four-page PDF of this policy brief.

Out of 660 metropolitan (areas with more than 50,000 people) and micropolitan (areas with populations of 2,500 to 50,000) areas tracked by Zillow, March 2022 housing prices exceeded the inflation-adjusted 2006-2008 peak in all but about 170. Major urban areas where prices had not yet reached the peak of the bubble include New York, Chicago, Washington, Baltimore, Minneapolis-St. Paul, and St. Louis. But prices in Atlanta, Charlotte, Dallas, Houston, and San Antonio are all well above their 2006-2008 peaks, not that any of these regions experienced much of a peak.

Continue reading