Fixing MBTA’s Financial Mess

Boston’s transit agency, the Massachusetts Bay Transportation Authority (MBTA or T for short), appears to be on the verge of collapse. Eight years ago, it reported a $7.3 billion repair backlog, which has probably grown since then. As I read its 2022 financial statement, it also has $5.4 billion in unfunded pension and health care liabilities.

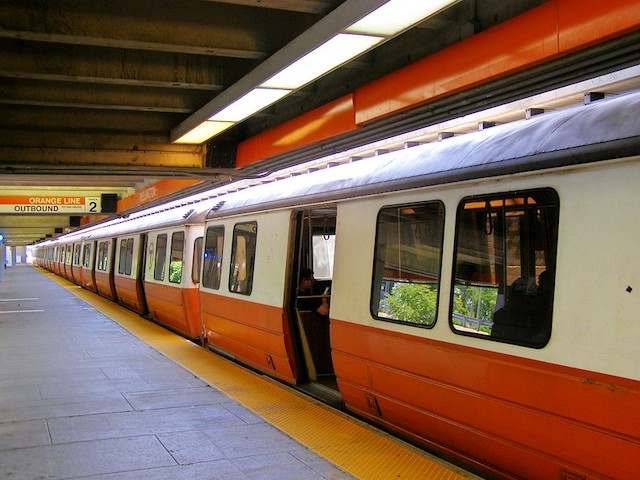
No one was particularly surprised when an Orange Line train caught fire last year. Photo by Marissa Babin.

State officials have known about the T’s serious maintenance and safety problems at least since 2009, when an outside report commissioned by the governor found that it had a $3 billion maintenance backlog and wasn’t even spending enough on maintenance to keep that backlog from growing further (which is why it grew to $7.3 billion six years later). This was creating serious safety problems, the report charged, finding that the agency’s maintenance program was addressing only about 10 percent of the system’s most serious safety issues. Continue reading

Changing the Game for the Worse

A 3/4-cent sales tax increase for transit is “seen as a game-changing model to fund transit service — and the envy of many cities nationwide,” reports the Minneapolis Star Tribune. What the article doesn’t say is how the tax will change the game for the worse for transit riders and transportation users in general.

Twin Cities transit ridership had been going downhill before the pandemic, declining nearly 10 percent between 2015 and 2019. Photo by Metro Transit.

What this means is that Metro Transit will no longer care about ridership numbers. Instead, it can freely spend hundreds of millions of dollars a year on projects that do little to generate ridership with no repercussions. Continue reading

A Polycentric Transit Plan for St. Louis

St. Louis has more miles of light rail than any other Midwestern urban area, yet fewer people rode St. Louis transit in 2019 than in 1991, before the region opened its first mile of light rail. According to a new report from the Show-Me Institute, this is because Metro, the region’s transit agency, has planned its transit system for the 1910s, not the 2020s.


Click image to download a 4.3-MB PDF of this report.

That means that Metro has built a system that assumes that most people work downtown, live in dense residential neighborhoods close to light-rail stops, and don’t have access to automobiles. None of those conditions have been true for at least 50 years, and Metro’s system is especially unsuited to the post-pandemic world. Continue reading

A Realistic Transit Game

Here’s a fun new game you can buy. It’s called Transform Transit and the goal of the game is to complete new transit projects such as building new stations or replacing the vehicle fleet. While attempting to manage projects, players have to keep employee morale up and get stooges transit bloggers to write glowing reviews of the projects.

One thing that is missing is actually getting people to ride transit, but that’s perfectly realistic as that no longer seems to be a goal of transit agencies. Related to that is increasing fare revenues, but again that’s no longer a goal of transit agencies. Instead, the goal is to keep politicians and political allies happy so the transit agency can get a continuous stream of subsidies to fund more projects. Continue reading

A Polycentric Plan for Portland

Portland’s TriMet transit agency is attempting to serve a 2020s urban area with a 1910 transit system, says a new report published by the Cascade Policy Institute. The agency’s infatuation with rail transit underscores this problem, as rail transit makes no sense for rapidly evolving regions with multiple economic centers. TriMet’s current route map works well only for downtown employees: while more than 40 percent of downtown workers took transit to work before the pandemic, less than 3.5 percent of workers in the rest of the urban area used transit.

The Cascade Policy Institute report proposes to replace TriMet’s current bus route map with a hub-and-spoke system using nine hubs. Yellow circles are the hubs. Blue lines represent non-stop buses from every hub to every other hub. Red lines represent local buses radiating away from each hub. The lines are not exact routes and only show the origins and (in the case of the red lines) approximate destinations of each route. Click image for a larger view.

All of these problems were made worse by the pandemic, which hit rail transit especially hard and which greatly reduced the importance of downtown Portland as an economic center. According to the latest report, Portland’s downtown has the second-worst recovery of any of the nation’s 50 largest downtowns, with less than 40 percent the economic activity of the pre-pandemic period. Yet TriMet still wants to build two new light-rail lines to downtown even though the last line it opened gained no net new riders for the transit system. Continue reading

Transport and Economic Opportunity: 2020

The nation’s fifty largest urban areas housed 82.5 million jobs in 2020, and auto drivers could reach 98 percent of them in an hour of travel. Transit riders, by comparison, could reach only 8 percent in an hour while bicycle riders could reach 7 percent, according to the University of Minnesota Accessibility Observatory.

The average resident of one of the nation’s fifty largest urban areas can reach 600,000 jobs in a 30-minute auto trip but only 85,000 jobs in a 50-minute transit trip and 92,000 jobs in a 50-minute bike ride.

I’ve previously cited the observatory’s 2019 data many times, but when writing yesterday’s post about travel speeds and productivity, I noticed that it has recently updated the data to 2020. The introduction says the data were collected before the pandemic so “the 2020 results may provide a useful baseline for evaluating the impact that COVID-19 had on access across America.” Continue reading

July 2023 Transit Ridership 65% of July 2019

After reaching 70 percent of pre-pandemic numbers in June, transit ridership in July fell back to 65 percent of July 2019, according to data released last week by the Federal Transit Administration. Since July 2019 had 22 working days while July 2023 only had 20, this decline is not surprising.

Meanwhile, Americans drove 97.2 percent as many miles in July 2023 as in the same month of 2019, according to Federal Highway Administration data released last week as well. Amtrak’s monthly performance report indicates that the railroad carried 91.2 percent as many passenger-miles in July 2023 as July 2019, while the Transportation Security Administration says that 98.8 percent as many travelers passed through security in July as in 2019. Continue reading

Driver Shortage; Money Shortage; What to Do?

Transit agencies are “scrambling” to find funding to keep operating in the face of permanently lower ridership. At the same time, driver shortages are hampering agencies’ ability to keep running buses and trains.

This driver was so overworked that she fell asleep at the wheel and crashed into a utility pole. Yet the bus she was driving was empty, so why were she and the bus there in the first place?

There’s an easy solution to both problems: reduce service. Why run buses and trains that are nearly empty? Ridership isn’t going to come back just because the transit vehicles are there. Cutting service to the levels agencies can afford to operate without further subsidies will also help alleviate driver shortages. Reducing service will in turn reduce greenhouse gas emissions and improve social equity because most of the taxes that would be needed to maintain service are regressive.

June Transit Carried 71% of Pre-COVID Riders

America’s transit agencies carried 71.4 percent as many riders in June 2023 as they did in the same month of 2019, according to data released by the Federal Transit Administration yesterday. This is the highest percentage of 2019 ridership since February, 2020. One reason for the gain above previous months is that June had two more business days in 2023 than it did in 2019.

Data are not yet available for highway or Amtrak travel. However, boarding numbers from the Transportation Security Administration indicate that the airlines carried 100.8 percent as many riders in June of 2023 as June of 2019. I’ll post updates for driving and Amtrak when those data are released. Continue reading

Transit’s Minuscule Share of 2021 Travel

Public transit carried 6.4 percent of 2021 motorized passenger travel in the New York urban area. It also carried 1.6 percent in Honolulu, 1.5 percent in San Francisco-Oakland, 1.4 percent in Seattle, 1.2 percent in Chicago, and 1.1 percent in Salt Lake City. In every other urban area it carried less than 1 percent; nationwide, transit carried just 0.7 percent of all motorized urban travel.

Chicago transit carried 1.2 percent, autos the other 98.8 percent of motorized passenger travel.

I calculated these numbers by comparing passenger-miles in the 2021 National Transit Database, which was released last fall, with daily vehicle miles of travel (DVMT) by urban area in table HM-72 of Highway Statistics, which was recently released by the Federal Highway Administration. To make the numbers comparable, I multiplied DVMT by 365 to get annual data and by 1.7 to account for vehicle occupancies, 1.7 being the result when dividing passenger-miles by vehicle-miles in Highway Statistics table VM-1. These numbers don’t include walking, bikes and e-bikes, or scooters, but they do include motorcycles. Continue reading