Scrutinizing July Transit Data

The Antiplanner is back from Wheeler County where I happened to meet some Portland transportation consultants who were cycling through the area. If you are reading this, I hope you had a good trip with no more mechanical problems.

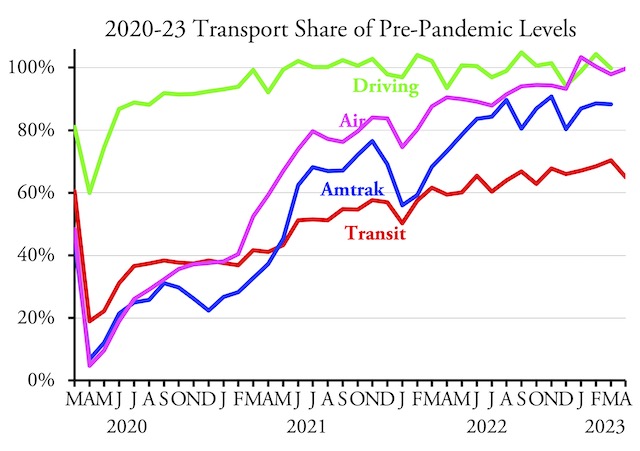
I promised I would take a closer look at the transit data that the FTA released last week. The data continue to show that rail transit is lagging behind bus ridership, with rail at 57 percent and bus at 61 percent of pre-pandemic levels. Yet worst off is commuter bus, at a mere 36 percent of July 2019 numbers. Rapid bus is 64 percent, and hybrid rail is at 82 percent — though that’s because a new line opened in North San Diego County since the pandemic began. Continue reading

Colorado Transit Lies about Free Transit

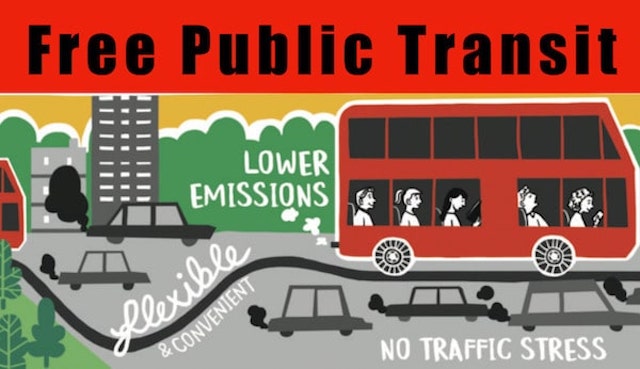
Colorado transit agencies convinced the state legislature to subsidize free transit for the month of August based on the flimsy claim that doing so would reduce air pollution. At the end of the money, the Colorado Association of Transit Agencies claimed the program was a great success, with many agencies seeing 30 to 50 percent increases in ridership compared with August, 2021.

Transit buses in Pueblo saw a 59 percent increase in ridership in August, but Pueblo’s transit system normally carries less than 0.75 percent of all transit riders in the state, so this increase wasn’t very important. Photo from Pueblo Transit.

The problem with this claim is that Colorado transit agencies were already seeing 30 to 50 percent increases in ridership compared with 2021 before they offered free transit. Colorado transit ridership in the first half of 2022 was 37 percent greater than the first half of 2021. Most of the increase in August was due to the recovery from the pandemic, not to free transit. Continue reading

Pandemic Reversal?

A recent article in the San Jose Mercury-News reports that transit ridership in “car crazy” Los Angeles has exceeded ridership in the “transit mecca” of the San Francisco Bay Area, a “reversal that could remake California’s mass transit landscape.” This would be a lot more interesting if the writer hadn’t done the arithmetic wrong.

Contrary to the implications of the Mercury-News story, Los Angeles has always been one of the biggest transit markets in the country and certainly bigger than that of the Bay Area. Photo by Downtowngal.

The story compares ridership carried by the major agencies in six San Francisco Bay Area counties with ridership carried by the main agencies in Los Angeles county. But Los Angeles County is not all of the Los Angeles urban area any more than San Francisco County is all of the San Francisco Bay Area. The Los Angeles urban area includes all of urban Los Angeles County and all of urban Orange County, while the Greater Los Angeles area also include three more counties. Continue reading

MBTA Crashes and Burns

The Massachusetts Bay Transportation Authority (MBTA) is crashing and burning, sometimes literally. An Orange line train caught fire a few weeks ago. A Red Line train ran away out of control. The Orange line and parts of the Green line are in such bad shape that they have been shut down at least until September.

The Orange line in 1978, when it was in a lot better condition than it is today. Photo by Henry Petermann.

The situation is so bad that various think tanks have proposed putting the agency in receivership, which would mean taking control from its highly politicized board of directors. At least one member of Congress from Massachusetts agrees, saying that the federal government should take control. But it’s not clear that federal oversight of DC’s Metro system did much to solve that system’s safety problems a few years ago. Continue reading

Gas Prices Push Transit Ridership Up to 65%

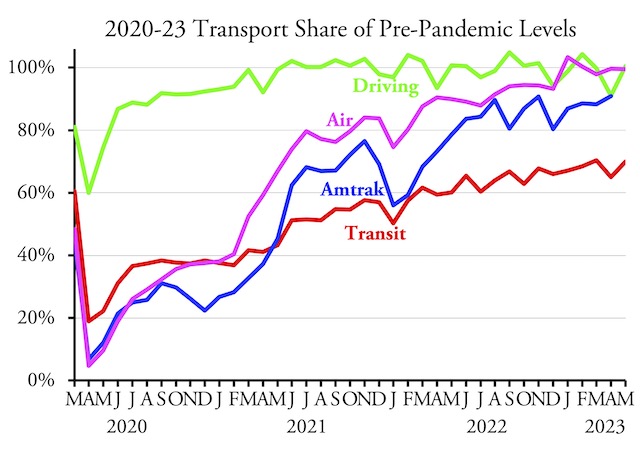
America’s transit systems carried 65.0 percent as many transit riders in June 2022 as in June 2019, according to data released last week by the Federal Transit Administration. This is the first time ridership has exceeded 61 percent of pre-pandemic levels since the pandemic began.

Data are not yet available for Amtrak or driving.

Much of this surge in ridership was due to fuel prices, which reached record levels in mid-June. Now the question is whether transit will be able to keep those riders, as prices have fallen every day since June 16. As of yesterday, average prices are lower than they have been since early March. Continue reading

The Importance of Fare Enforcement

According to the New York City police department, subway crime is up 53 percent so far in 2022 compared with 2021. Since ridership grew by 64 percent in that time period, that means that crime rates per rider have actually fallen, but that doesn’t reassure many people.

This photo was taken by MassDOT in 2010, when the MBTA could say that 2009 crime had reached a 30-year low. Yet FTA data show that, by 2021, the MBTA suffered almost 19 times as many “security events” as in 2009: 94 vs. 5.

Nationwide, Federal Transit Administration data show that, through the end of March 2022, transit crime (not counting suicide) is 44.4 percent more than the same period in 2021. This is almost exactly the same as the increase in ridership, which was 44.9 percent. Former riders who are reluctant to return to transit may be justified in not doing so. Continue reading

Transit’s Existential Crisis

In November 2020, a report from McKinsey & Co. to the New York Metropolitan Transportation Authority predicted that transit ridership would recover to as high as 92 percent of pre-pandemic levels by 2025. Now McKinsey has revised that number downward to as low as 70 percent. Even that is probably optimistic considering that recent data indicate that New York subway ridership has been flat at least since February 2022, and has even declined somewhat since June.

In McKinsey’s study, scenario S1 assumes people will steadily return to working in offices while the much more likely S2 assumes many will continue to work at home at least three days a week. Neither is good news for New York City transit but S2 is particularly bad, especially since even it is probably optimistic.

More than in most cities, transit in New York depends on fare revenues. Before the pandemic, fares covered more than half the operating costs of New York City transit but only about a quarter of the costs elsewhere. A decline in ridership hits the city’s transit budget harder than almost anywhere else, so it’s no surprise that both national and local media are focused on the “fiscal cliff” that MTA is likely to hurdle over when it runs out of federal COVID relief funds, probably in 2024. Continue reading

“Equity” Means Less, Not More Transit Subsidies

Danny Westneat, a columnist for the Seattle Times, openly wonders why Seattle is building so much light rail when we seem to be entering “an era of ‘untransit.'” He quotes a Stanford law review article saying that Zoom is “the modern equivalent of the streetcar — a technological advance that will profoundly alter land use.”

Puget Sound Transit is spending tens of billions of dollars building high-cost, low-capacity transit lines that make even less sense after COVID than they did before, yet there is no indication that Sound Transit is changing is plans in response to the pandemic. Photo by brewbooks.

Instead of altering their plans, however, transit agencies and transit advocates are busy trying to figure out how to justify increased subsidies for decreased ridership. Many of them are hoping that “equity” can be the issue that tips the balance in favor of more subsidies. Continue reading

May Transit 59.5% of Pre-Pandemic Levels

Transit ridership remained below 60 percent of pre-padenmic levels in May 2022, according to data released by the Federal Transit Administration yesterday. This was only a slight improvement over April’s 58.7 percent despite average fuel prices climbing from a little over $4 in April to more than $4.50 in May.

Amtrak passenger miles, meanwhile, reached 78.5 percent of May 2019, a 5 percent climb from April. Air travel remained right around 90 percent of pre-pandemic levels. Driving data will be released later this month. Continue reading

New Trolleys for Philadelphia

The Southeastern Pennsylvania Transportation Authority (SEPTA) is buying new vehicles to replace 130 light-rail cars. Normally, my suggestion when rail systems wear out is to replace them with buses, but in this case it’s worth a close look.

One of SEPTA’s 40-year-old light-rail cars. Photo by jpmueller99.

The 130 cars are expected to cost $800 million, or a little over $6.1 million apiece. That’s a lot more than a bus, which typically costs under $500,000 if Diesel-powered and under $1 million if electric. But buses have an expected lifespan of only about 15 years, while SEPTA’s light-rail cars are 40 years old. The railcars are also a little larger than buses, having 50 seats compared with an average of 40 seats on SEPTA buses. Still, the railcars cost more than $3,000 per seat-year, while even million-dollar buses cost only $1,666 per seat-year. Continue reading