Search Results for: honolulu rail

10. Los Angeles Metro’s New Climate Strategy

Los Angeles is “hemorrhaging bus riders,” worries the Los Angeles Times. This is supposedly “worsening traffic and hurting climate goals.”

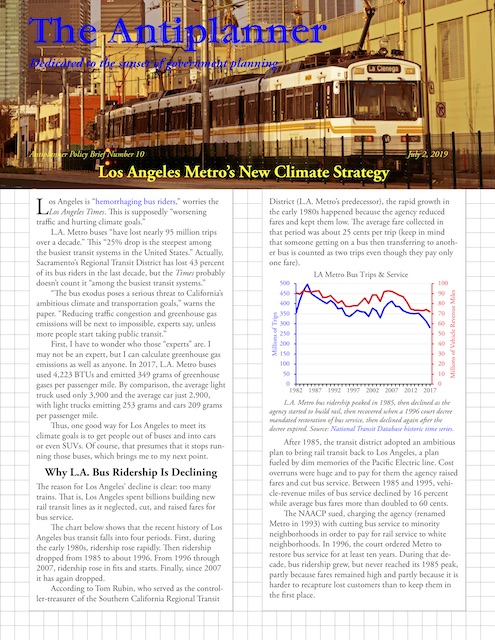
Click image to download a PDF of this policy brief.

L.A. Metro buses “have lost nearly 95 million trips over a decade,” the paper notes. This “25% drop is the steepest among the busiest transit systems in the United States.” Actually, Sacramento’s Regional Transit District has lost 43 percent of its bus riders in the last decade, but the Times probably doesn’t count it “among the busiest transit systems.” Continue reading

The Nation’s Worst Transit Agencies

The Antiplanner has often called San Jose’s Valley Transit Authority (VTA) the nation’s worst transit agency (with some competition from DC Metro). It would be nice, however, to confirm that with hard data. The question is what are the best ways to measure agency performance?

A previous comparison of transit agencies used 23 different measures of performance. Some of these were outputs, such as trips per capita and farebox recovery. Most, however, were inputs, such as revenue miles, expenses per capita, and vehicle miles between failures. But inputs are not a sound measure of performance; an agency can spend a lot of money but carry few riders; it can run a lot of vehicle miles, but if they don’t go where people want to go, they are not serving the public well; it can have lots of breakdowns, but if people are still riding it, it must be doing something good.

So I want to focus on outputs, and I’ve tentatively identified four: Continue reading

VTA Faces $25 Million Deficit

The Santa Clara Valley Transportation Authority (VTA), which the Antiplanner has sometimes called the nation’s worst-managed transit agency, is facing a $25 million deficit next year, which will probably lead to service cuts. As the Friends of Caltrain (the commuter rail line that connects San Jose to San Francisco) note, the elephant in the room is whether VTA should go forward with its plans for billions of dollars of capital projects when it can’t afford to run the system it already has.

Friends of Caltrain doesn’t specifically say so, but the real elephant is VTA’s plans to extend the BART line to downtown San Jose. VTA is “97 percent complete” building a 10-mile line from Fremont to Berryessa (a neighborhood in north San Jose). This line, which is costing $2.3 billion, was supposed to be open at the beginning of 2018, but thanks in part to a scandal over a contractor’s use of used parts in construction, the opening has been delayed until late 2019. (An update from Friends of Caltrain says the VTA board was willing to look at capital projects, but still did not specifically mention BART.)

Extending the line another 6.5 miles to downtown San Jose is expected to cost another $4.7 billion, or more than $720 a mile, mainly because much of it will be underground. VTA expects to ask the Federal Transit Administration to cover $1.5 billion of this amount, leaving local taxpayers to cover the rest. If this project is ever completed, BART riders arriving in downtown San Jose are likely to find a stripped-down transit system that probably won’t take them where they want to go if it is more than a couple of blocks from the BART station. Continue reading

The Antiplanner’s Library
Trains, BRT, People — But Don’t Count Costs

Christof Spieler was on the Houston Metro board of directors for eight years, so he thinks he understands transit. Unlike many transit advocates, he is willing to admit that some transit projects, such as Nashville’s commuter train, Cincinnati’s streetcar, and even the St. Louis light-rail system, are failures. “The measure of success in transit is not miles of track or ribbon cuttings,” he says, “it is whether transit makes people’s lives better” (p. 1).

But while his book is called Trains, Buses, People, it almost completely ignores bus service unless that service uses dedicated lanes. Instead, it reviews transit service only in the 47 cities that have or are building either rail transit or dedicated bus lanes. Cities that don’t have these things are ignored. For example, the book devotes several pages each to transit in Austin, Dallas-Ft. Worth, and Houston but leaves out San Antonio, even though San Antonio transit carried more trips per capita in 2017 than transit in any of the other three Texas urban complexes. Continue reading

2017 National Transit Database Released

Transit ridership dropped by 2.9 percent in 2017 despite a 0.7 percent increase in transit service (as measured in vehicle revenue miles). This isn’t big news to Antiplanner readers, but it’s a little more official with the release, earlier this week, of the 2017 National Transit Database. While we’ve previously looked at calendar year or July through June ridership numbers, the database uses the fiscal years of the individual transit agencies, which may range anywhere from July 2016 through June 2017 to January 2017 through December 2017, so the numbers won’t be exactly the same.

The full database also includes fares, costs, energy consumption, and other information not previously available for 2017. For example, transit used an average of 3,376 BTUs per passenger mile in 2017, a 2.3 percent increase from 2016. Greenhouse gas emissions per passenger mile also increased by about 1.0 percent. These increases, of course, are due to the increased vehicle miles combined with a 2.6 percent fall in passenger miles.

Transit’s 3,376 BTUs per passenger mile is just about tied with light trucks (pick ups, SUVs, full-sized vans), but well behind the average car. In 2015, cars used only about 3,030 BTUs per passenger mile and may have been even more energy efficient in 2017. Continue reading

Why Is America Keeping Transit Alive?

CityLab‘s article, How America Killed Transit, concludes that “service drives demand.” What the writer, an urban planner named Jonathan English, means is that more frequent service results in more riders, and he bemoans the fact that cities like Washington, Atlanta, Portland, and Dallas that built expensive rail systems failed to support those systems with frequent feeder buses.

Yet English (whose twitter handle is @englishrail) fails to realize that the reason why service is often poor is that rail construction is so expensive that transit agencies didn’t have enough money left over to provide decent bus service. That’s why transit’s share of commuting was growing in Houston and Phoenix before they built rail and declined afterwards, and why it grew in Las Vegas, which didn’t build rail, even as it declined in Denver and Salt Lake City, which did.

Yet English’s larger premise, that “America killed transit,” is simply wrong-headed. America didn’t kill transit; new technologies did. When he claims we didn’t provide enough service, what he really means is we didn’t provide enough subsidies. But at some point there are diminishing returns to subsidies, and when you are already paying a dollar or more per passenger mile, you are beyond that point. Continue reading

Can Transit Save Itself by Going Driverless?

With ridership declining, fare revenues are also declining, and these revenues provide an average of one-third of transit agency operating funds. One way transit agencies can save money is to go driverless. While driverless buses are several years away, driverless rail lines have been around for quite some time.

The International Public Transport Association defines three levels of automated transit: level 4 requires no human operators; level 3 requires a human operator just for emergency situations; and level 2 requires a human operator for emergencies and to close the doors. Level 1 is unautomated.

Most airport trains in the United States are level 4. While BART and Washington Metro could have been level four, unions demanded at least “one employee per train,” so they were operated as level 2. Since the 2009 crash, which was caused by failure to maintain the computer system, most DC Metro lines have been operated as level 1. Honolulu’s rail line is supposed to be fully automated, but it isn’t certain it will ever be finished as its cost is proving to be far greater than expected. Continue reading

Transit’s Share of Motorized Passenger Miles

In 2016, transit carried less than 12 percent of motorized travel in the New York urban area, 7 percent in San Francisco-Oakland, 4 percent in Honolulu, between 3 and 4 percent in Chicago, Seattle, and Washington, between 2 and 3 percent in Baltimore, Boston, Philadelphia, and Portland, and between 1 and 2 percent in Denver, Los Angeles, Miami, Minneapolis-St. Paul, Pittsburgh, Salt Lake City, San Diego, and San Jose. Just about everywhere else was under 1 percent.

I calculated these numbers using table HM72 of the 2016 Highway Statistics, which the Federal Highway Administration published last month, and the 2016 National Transit Database, which the Federal Transit Administration published last October. I calculated these numbers for the 200 largest urbanized areas and included them in my summary 2016 Transit Database spreadsheet. I also corrected a few other problems with that spreadsheet (some transit agencies were assigned to the wrong urban areas), so if you downloaded it before, you should do so again even if you aren’t interested in total motorized passenger miles.

In calculating total motorized passenger miles, I used total vehicles miles multiplied by the average vehicle occupancy of 1.67. I then added transit passenger miles. There is a slight overlap as bus vehicle miles would have been included in highway vehicle miles, but it is not significant. The results are in columns AL through AQ of rows 3851 through 4050. Continue reading

The Case for Neglecting Transit

The American Public Transportation Association has just published a paper on the economic cost of failing to modernize transit. The paper claims that the roughly $100 billion maintenance backlog built up by U.S. transit agencies — mostly for rail transit — will reduce “business sales” by $57 billion a year and reduce gross national product by $30 billion a year over the next six years.

Reaching this conclusion requires APTA to make all sorts of wild claims about transit. For example, it claims that a recent New Orleans streetcar line stimulated $2.7 billion in new infrastructure. In fact, that new infrastructure (including a Hyatt Regency) received hundreds of millions of dollars of subsidies and low-interest loans from Louisiana and New Orleans. In any case, APTA fails to make clear how rehabilitation of existing infrastructure could generate the same economic development benefits as building new infrastructure. Continue reading

Portland’s Congestion Plans Are Working

Portland’s transportation policies are working. At least, they’re working if you think their goal is to increase congestion in order to encourage people to find alternatives to driving. At least, the increased-congestion part is working, but not many are finding alternatives to driving.

According to Waze, Portland has the fifth-most-miserable traffic in the United States. Waze is an app that asks its users to rate their driving experiences. Rather than just measure hours of delay, Waze’s driver satisfaction index is based on a variety of indicators including traffic, road quality, safety, driver services, and socio-economic factors such as the impact of gas prices on the cost of living.

Waze calculates the index for any area that has more than 20,000 Waze users, which means 246 metropolitan areas in 40 countries. Nationally, the U.S. is ranked number three after the Netherlands and France. In terms of congestion alone, the United States ranks number one (that is, has the least congestion). The Netherlands and France edge out the U.S. in overall scores because of their higher road quality and safety ratings. Continue reading