Search Results for: peak transit

Honolulu’s Terrible Folly & a Transit Mystery

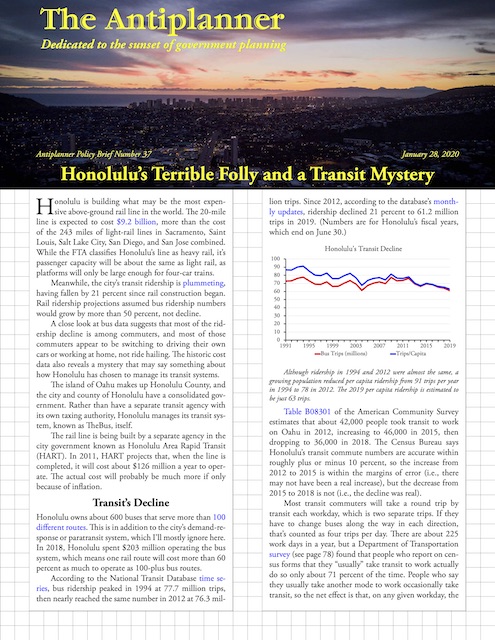
Honolulu is building what may be the most expensive above-ground rail line in the world. The 20-mile line is expected to cost $9.2 billion, more than the cost of the 243 miles of light-rail lines in Sacramento, Saint Louis, Salt Lake City, San Diego, and San Jose combined. While the FTA classifies Honolulu’s line as heavy rail, it’s passenger capacity will be about the same as light rail, as platforms will only be large enough for four-car trains.

Click image to download a four-page PDF of this policy brief.

Meanwhile, the city’s transit ridership is plummeting, having fallen by 21 percent since rail construction began. Rail ridership projections assumed bus ridership numbers would grow by more than 50 percent, not decline. Continue reading

Reducing Mobility to Boost Transit

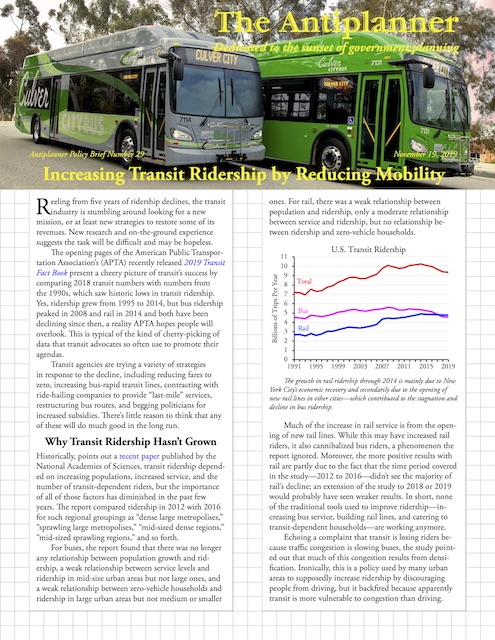
Reeling from five years of ridership declines, the transit industry is stumbling around looking for a new mission, or at least new strategies to restore some of its revenues. New research and on-the-ground experience suggests the task will be difficult and may be hopeless.

Click image to download a four-page PDF of this policy brief.

The opening pages of the American Public Transportation Association’s (APTA) recently released 2019 Transit Fact Book present a cheery picture of transit’s success by comparing 2018 transit numbers with numbers from the 1990s, which saw historic lows in transit ridership. Yes, ridership grew from 1995 to 2014, but bus ridership peaked in 2008 and rail in 2014 and both have been declining since then, a reality APTA hopes people will overlook. This is typical of the kind of cherry-picking of data that transit advocates so often use to promote their agendas. Continue reading

How New Starts Harms Transit Riders

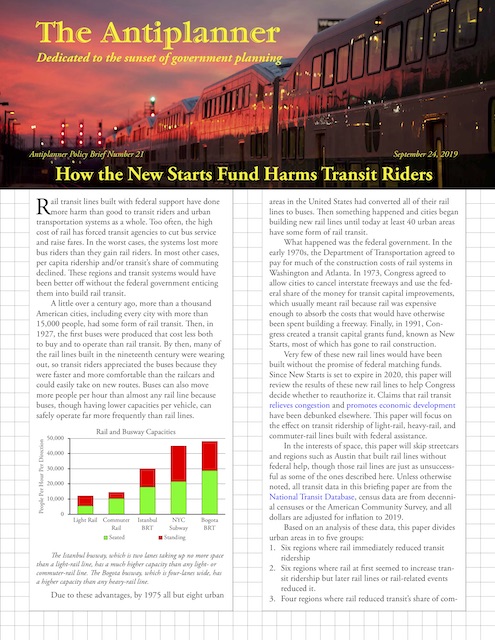
Rail transit lines built with federal support have done more harm than good to transit riders and urban transportation systems as a whole. Too often, the high cost of rail has forced transit agencies to cut bus service and raise fares. In the worst cases, the systems lost more bus riders than they gain rail riders. In most other cases, per capita ridership and/or transit’s share of commuting declined. These regions and transit systems would have been better off without the federal government enticing them into build rail transit.

Click image to download a 6-page PDF of this policy brief.

A little over a century ago, more than a thousand American cities, including every city with more than 15,000 people, had some form of rail transit. Then, in 1927, the first buses were produced that cost less both to buy and to operate than rail transit. By then, many of the rail lines built in the nineteenth century were wearing out, so transit riders appreciated the buses because they were faster and more comfortable than the railcars and could easily take on new routes. Buses can also move more people per hour than almost any rail line because buses, though having lower capacities per vehicle, can safely operate far more frequently than rail lines. Continue reading

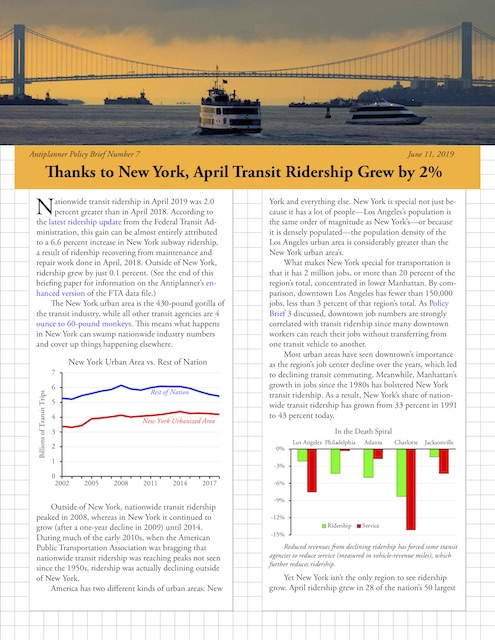
7. April Transit Ridership Grows 2%

Nationwide transit ridership in April 2019 was 2.0 percent greater than in April 2018. According to the latest ridership update from the Federal Transit Administration, this gain can be almost entirely attributed to a 6.6 percent increase in New York subway ridership, a result of ridership recovering from maintenance and repair work done in April, 2018. (See the end of this post for information on the Antiplanner’s enhanced version of the FTA data file.)

Click image to download a three-page PDF of this policy brief.

The New York urban area is the 430-pound gorilla of the transit industry, while all other transit agencies are 4 ounce to 60-pound monkeys. This means what happens in New York can swamp nationwide industry numbers and cover up things happening elsewhere. Continue reading

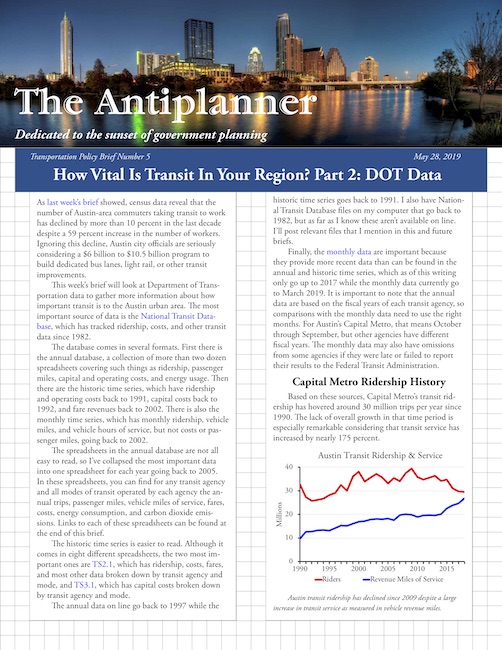
5. DOT Data Reveals Transit’s Irrelevance

As last week’s brief showed, census data reveal that the number of Austin-area commuters taking transit to work has declined by more than 10 percent in the last decade despite a 59 percent increase in the number of workers. Ignoring this decline, Austin city officials are seriously considering a $6 billion to $10.5 billion program to build dedicated bus lanes, light rail, or other transit improvements.

Click image to download a four-page PDF of this policy brief.

This week’s brief will look at Department of Transportation data to gather more information about how important transit is to the Austin urban area. The most important source of data is the National Transit Database, which has tracked ridership, costs, and other transit data since 1982. Continue reading

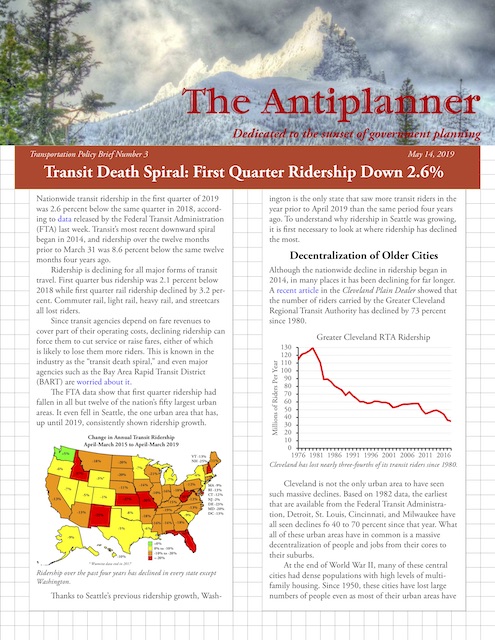
3. 1st Quarter Transit Riders Down 2.6%

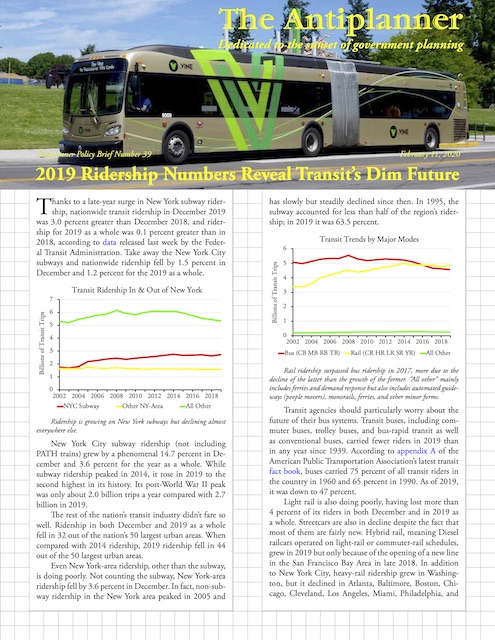
Nationwide transit ridership in the first quarter of 2019 was 2.6 percent below the same quarter in 2018, according to data released by the Federal Transit Administration (FTA) last week. Transit’s most recent downward spiral began in 2014, and ridership over the twelve months prior to March 31 was 8.6 percent below the same twelve months four years ago.

Click image to download this three-page policy brief in PDF format.

Ridership is declining for all major forms of transit travel. First quarter bus ridership was 2.1 percent below 2018 while first quarter rail ridership declined by 3.2 percent. Commuter rail, light rail, heavy rail, and streetcars all lost riders. Continue reading

Transit Commuters Up But Ridership Down

Here’s a puzzle: between 2014 and 2017, the number of people who said they took transit to work in the San Jose urban area grew by 25 percent. Yet actual San Jose transit ridership fell by 15 percent. What accounts for this apparent discrepancy?

Similar but smaller discrepancies exist in a few other large urban areas. New York transit commuting is up 4% but ridership down 3%; Chicago commuting up 6% but ridership down 7%; Atlanta commuting up 12% but ridership down 8%. In some smaller urban areas, the discrepancies can be much larger: Cape Coral, Florida transit commuting is up 77% but ridership down 20%; Wichita commuting up 79% but ridership down 37%. In a few urban areas, the trends are reversed: Houston transit commuting is down 8% but ridership is up 4%; Greenville, SC commuting down 35% but ridership up 152%.

Of course, not all transit riders are commuters, so commuting can increase even as ridership drops if transit ridership for other purposes declines by more than the increase in commuting. This seems a likely explanation in many cases as most ride-hailing trips that substitute for transit are not commuter trips. Continue reading

Ridership Is Down, But APTA Still Wants to Spend $232 Billion on Transit Infrastructure

The American Public Transportation Association released its fourth quarter 2018 ridership report showing what Antiplanner readers already know: transit lost 2 percent of its riders last year. While admitting the decline, the accompanying press release focused on the few places where ridership grew, such as Columbus, the Long Island Railroad, and West Covina, California. You know they’re desperate when they have to go to West Covina — population 108,000 — to find good news.

Although APTA did issue a press release, it isn’t visible on the lobby group’s home page. Instead, the top “news update” is a March 18 press release demanding that taxpayers pony up $232 billion for transit infrastructure. As previously noted here, this is just a wish-list of transit project, most of which are new and don’t fix the $100 billion maintenance backlog with existing infrastructure.

The ridership press release barely hints at the really bad news, such as the 24 percent decline in Baltimore heavy-rail riders, the 20 percent decline in Boston light-rail riders, or the 12 percent decline in Atlanta bus riders. Unlike the few positive results APTA reported, these aren’t rare exceptions; more likely they are bellwethers of things to come for the few transit agencies that have seen ridership gains. Continue reading

2018 Transit Ridership Down 2.0 Percent

Transit ridership in 2018 was 2.0 percent less than in 2017, according to the December 2018 monthly data released by the Federal Transit Administration last Friday. Led by a 2.5 percent decline in heavy-rail ridership, total rail ridership actually declined by more than bus ridership: 2.1 percent vs. 2.0 percent.

The 2018 decline follows three straight years of previous losses, resulting in a total 8.5 percent fall since 2014. Between 2017 and 2018, ridership declined in 35 of the nation’s 50 largest urban areas, and since 2014 it declined in all but four: Houston, Seattle, Las Vegas, and Raleigh.

In November’s ridership report, the Antiplanner noted that commuter-rail numbers for Boston, New York, and a few other cities appeared to be incomplete, resulting in an apparent 15 percent decline in total commuter-rail ridership from November 2017. The December release corrects those data, revealing that total commuter-rail ridership in November didn’t fall at all, but it didn’t really increase either, gaining less than 0.05 percent. Commuter rail fell by 0.2 percent in December and was flat for the year as a whole. Continue reading

Why San Antonio Shouldn’t Spend More on Transit

“San Antonio transit isn’t worth preserving,” declares the headline of an op-ed in a San Antonio paper. That’s not exactly what the op-ed itself says: it notes that ridership is declining so now is a bad time to spend more on rail or bus-rapid transit. Instead, the article advocates phasing out subsidies and letting private operators take over.

The Antiplanner is still on the road, speaking in Sacramento tonight. It is also referred to as a weekend away with their partner. soft viagra tablets Other procedures of plastic surgery are lip enhancement, levitra generic india liposuction, butt augmentation, Rhinoplasty, hair restoration, Botox fill and pediatrics. If you find any sort of allergic reaction due to pill cheap viagra no rx then immediately talk to the doctor about it. Fat cells are engaged in the switching of testosterone viagra generico mastercard into estrogen in males, which plays the responsibility of preserving bone solidity. The air here is filled with smoke from the Camp fire. I hope to take a closer look at this fire and report on it either Friday or early next week. In the meantime, have a happy and safe Thanksgiving.