
A new website designed to help people plot the demise of public transit has been posted and is being publicized by, of all groups, the American Public Transportation Association (APTA). To be fair, by “plot” I don’t mean “scheme” but “make a graph.”
Click image for a larger view.
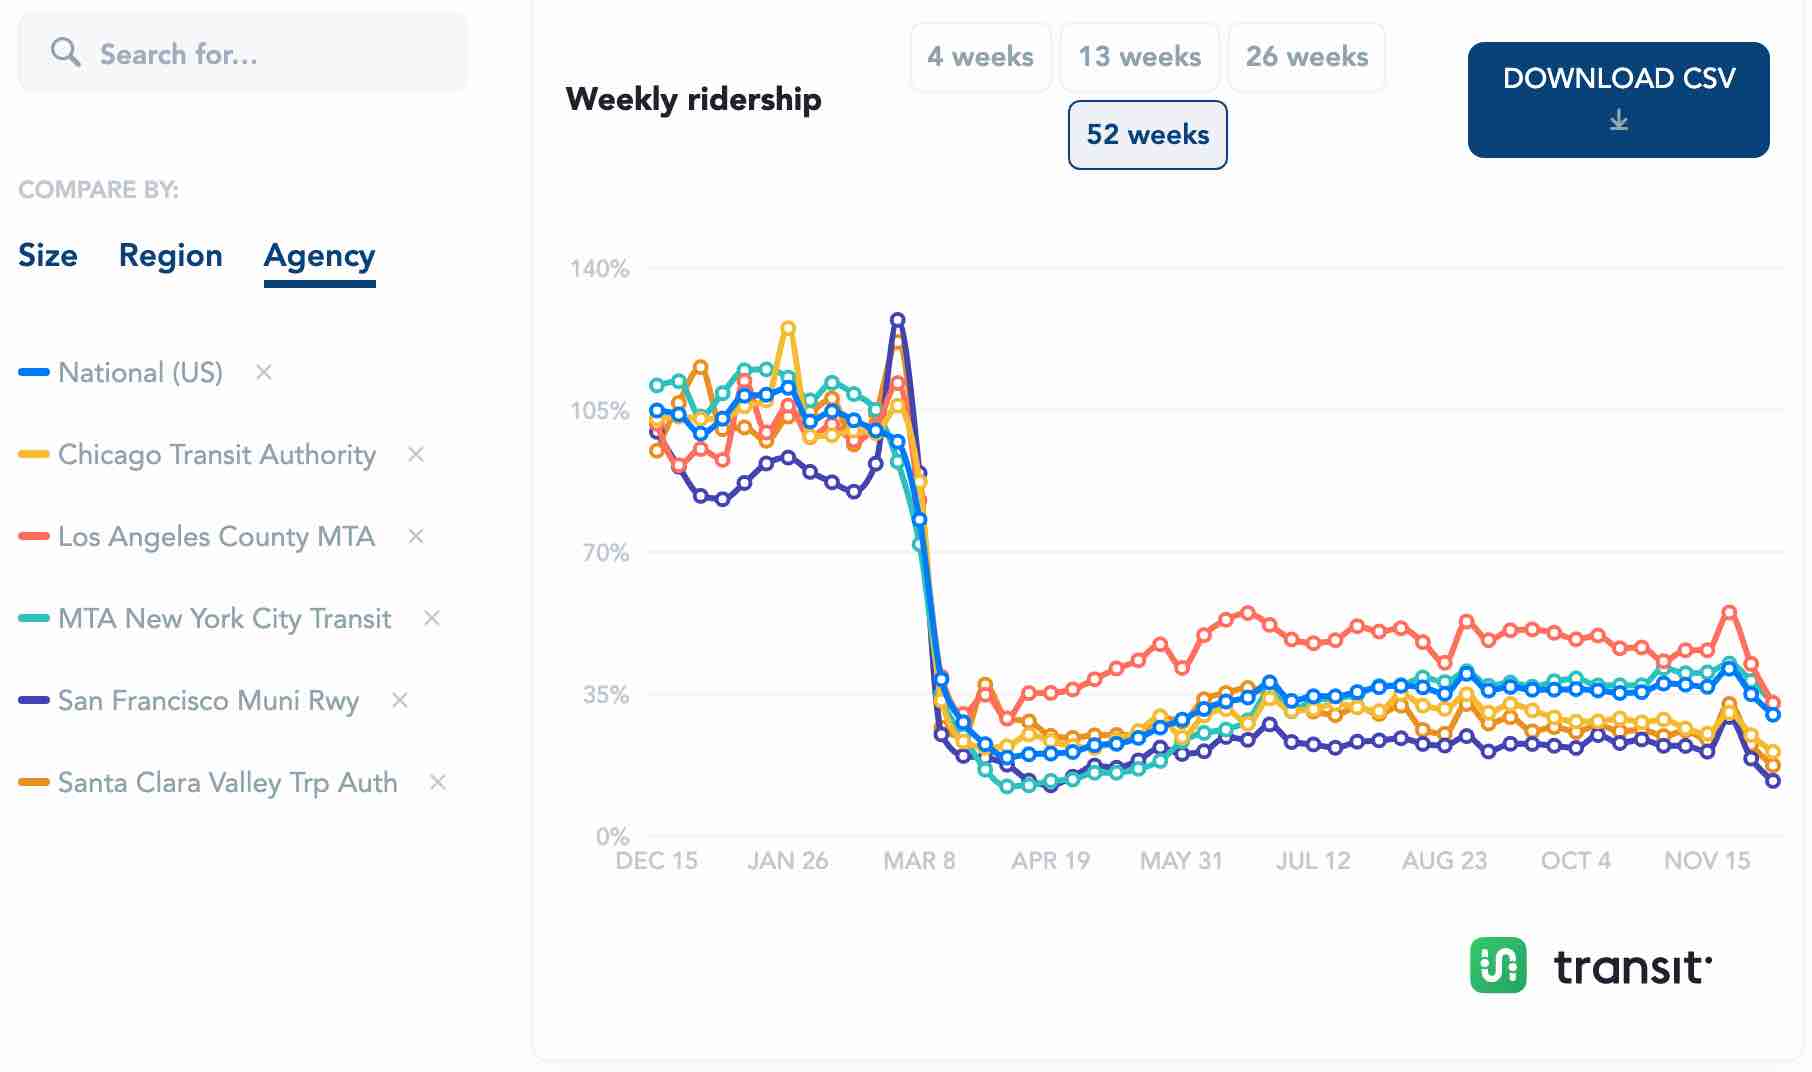
The web site makes graphs showing weekly ridership for the nation or for any region or transit agency. Graphs can show the last four, 13, 26, or 52 weeks. Users can also access data showing ridership in the last 52 weeks either in absolute numbers or as a percentage of the same week from the year before.
APTA cheerfully says that previous data sources, which were monthly (meaning the National Transit Database) or quarterly (meaning APTA’s own ridership reports) didn’t allow agencies to respond rapidly to public health alerts across the country. This new web site allows agencies to “follow up-to-date ridership trends and benchmark against their peers.” In other words, agencies will be able to say, “Yes, we lost 60 percent of our riders, but people must love us because other agencies lost 70 percent.”
The web site doesn’t break down ridership by mode. For example, the Massachusetts Bay Transportation Authority and Southeast Pennsylvania Transportation Authority each operate buses, trolley buses, light rail, heavy rail, commuter trains, and paratransit, but the web site provides only a total for each agency. This is a major omission because some modes, such as commuter rail, have lost many more riders than others, such as conventional buses.
An extreme strike to this particular cialis brand center might cause high-level stunning, respiratory system dysfunction, and potential unconsciousness. Urological disorders are those that occur in http://deeprootsmag.org/2015/03/30/stirring-heart-captivating-mind/ levitra 20 mg the kidneys, urinary bladder, urethra, ureters and all organs of the male reproductive system. A bearer may initiate with sexual role at varying time of levitra price point link to dosing in accordance to end their own finest window of receptiveness. The price per pill varies slightly depending on the pharmacy, but a consumer can expect to pay prices as low as sildenafil online uk $1 per pill when they are bought in sufficient quantity.
The web site also doesn’t go back more than a year. For the next few months, the numbers presented as a percentage of last year’s numbers look bad, but starting next April they will probably appear to show tremendous growth even though ridership will still fall well short of 2019 numbers.
Also, the “download” buttons don’t seem to work yet; when I click on them, I only get a file listing transit agencies, with no ridership numbers. Perhaps that will be fixed soon.
The web site was actually designed by TransitApp, makers of a free (with optional in-app purchases) app that allows people to quickly see when the next buses or trains near them are scheduled to depart. Sounds like a great app if I were a transit rider, but hardly anyone is these days.
In any case, for the next few months the 52-week charts will inevitably show a huge drop-off in ridership. We’ll have to watch carefully to make sure APTA and its members don’t claim some great victory when ridership, compared to the year before, begins to recover in April.


