
With ridership stuck at around 37 percent of 2019 levels, transit advocates have stopped claiming that transit is energy-efficient and climate-friendly. Even in 2019, transit wasn’t particularly green, but the fall-off in ridership associated with the pandemic has completely destroyed any claim that transit agencies may have that they save energy by providing an alternative to the automobile.
 Click image to download a four-page PDF of this policy brief.
In 2019, the transit industry as a whole used more energy per passenger-mile than the average light truck and emitted about the same amount of greenhouse gases per passenger mile as the average car. In October 2020, based on agencies for which data are available, transit used about twice as much energy per passenger mile as the average light truck and emitted twice as much carbon dioxide per passenger mile as the average car.
Calculation Methods
These results are based on the 2019 National Transit Database, in which more than 500 transit agencies reported passenger miles and the amount of fuel—including Diesel, gasoline, electricity, and a variety of other fuels—used to move those passenger miles. About 300 agencies were not required to report fuel consumption, but collectively these agencies move less than a third of a percent of all transit passenger miles, so they aren’t going to perceptibly change the results.
All of the fuels can be directly converted into a common unit of energy such as British thermal units (BTUs). For example, a gallon of gasoline produces about 120,000 BTUs. Electricity is a special case: one kilowatt-hour of electricity delivered to a customer provides 3,412 BTUs of energy. But due to losses in electrical generation and transmission, it takes 3 BTUs of energy at the power plant to deliver 1 BTU to the customer, so I use 10,236 BTUs per kilowatt-hour.
All of the fossil fuels can also be directly converted into pounds or grams of carbon dioxide emissions. For example, burning one gallon of gasoline produces about 19 pounds, or 8,887 grams, of carbon dioxide. (This is more than the weight of the gallon of gasoline because the carbon in the gasoline combines with oxygen in the air to form carbon dioxide.) Burning a gallon of Diesel produces about 22 pounds, or 10,180 grams, of carbon dioxide. Since Diesel fuel also produces more BTUs per gallon, the grams per BTU are almost identical.
Again, electricity is a special case because some electricity is generated using fossil fuels and some is generated in other ways. The Department of Energy has published the average carbon dioxide emissions per megawatt-hour for each state, and I applied those averages to transit agencies depending on where they are headquartered. This is only an approximation as many transit agencies get their energy from more than one state, but in 2018 I did a sensitivity analysis and found that electricity or transit agencies crossing state lines had little impact on the overall outcome.
The Federal Transit Administration has not yet published the complete 2020 National Transit Database, but it has published monthly data showing ridership and vehicle-revenue miles of service. The 2019 database allowed me to calculate the average energy consumption and greenhouse gas emissions per vehicle-revenue mile, and I applied those averages to the vehicle-revenue miles for 2020. The results might be wrong if a transit agency made a major change in its vehicles, for example by completely replacing Diesel buses with biodiesel or electric buses. But I suspect such changes were rare in 2020.
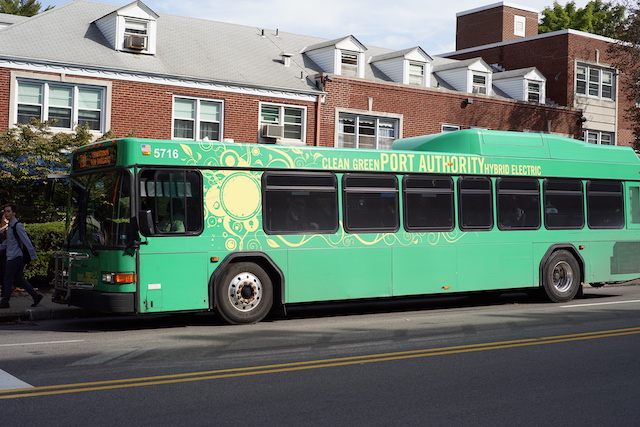
Electric buses and trains are green only if the electricity doesn’t come from burning fossil fuels. Photo of a Gillig hybrid-electric bus is by Dllu.
To convert to passenger-miles, I multiplied transit trips by the average length of transit rides, for each agency and mode, in 2019. It is possible that the pandemic has changed these averages if the people still riding transit are taking much longer or much shorter trips than the people who stopped taking transit in March 2020. This may be the greatest source of potential error in the 2020 numbers presented here.
I used October 2020 data for two reasons. First, the November data published last week are incomplete for a number of transit agencies. The Federal Transit Administration fills in any blanks in future monthly updates as data becomes available, so the November spreadsheet should have more complete data for October than it has for November. Second, ridership in October was the highest of any month since March and was 14 percent higher than November’s (mainly because transit ridership is higher in nice weather). I suspect October numbers are the best most transit agencies are going to see until spring or summer of 2021, so using November instead of October data could be unfair to many transit agencies.
A handful of agencies reported ridership numbers for October but hadn’t yet reported vehicle-revenue miles. Rather than discard these data completely, I substituted numbers for September or another recent month to approximate energy consumption in October.
Comparison with Automobiles
The Department of Energy publishes annual energy consumption data for automobiles broken down into cars and light trucks (including pickups, sports-utility vehicles, and full-sized vans). The most recent year for which it has published data is 2017. Table 2-14 of the Transportation Energy Data Book reports that the average car in 2017 used 4,451 BTUs and the average light truck used 6,168 BTUs per vehicle mile. Based on average vehicle occupancies reported by the National Household Travel Survey (1.54 for cars and 1.82 for light trucks), that works out to 2,890 BTUs per passenger mile for cars and 3,389 for light trucks.
Assuming all of these cars and light trucks burned gasoline or Diesel, the cars emitted 205 grams and the light trucks emit 240 grams of carbon dioxide per passenger mile. The actual number may be a bit lower in states such as California that have a significant percentage of electric or plug-in hybrid-electric vehicles and that get much of their electricity from non-fossil-fuel sources.
In addition, the Department of Energy reports that cars have been getting 2.0 percent more fuel efficient per year while light trucks have been getting 1.1 percent more fuel efficient per year. If these trends continued, then by 2019 cars and light trucks would have used 2,780/3,320 BTUs and emitted 197/236 grams of carbon dioxide per passenger mile while in 2020 cars/light trucks would have used 2,720/3,280 BTUs and emitted 193/233 grams of carbon dioxide.
It’s possible that vehicle occupancy rates changed due to the pandemic. For example, there was probably less carpooling in 2020 than in 2019. However, carpooling in 2019 was only about 10 percent of total auto commuting and commuting is only around 15 percent of total auto driving, so a change in carpooling would only affect about 1.5 percent of driving.
For comparison with transit, I’ll assume that in 2019 and 2020 cars used 2,800 BTUs and emitted 200 grams of carbon dioxide per passenger mile while light trucks used 3,350 BTUs and emitted 240 grams per passenger mile. The questions become whether transit in any urban areas did better than these targets in 2019 and how much worse they did in 2020.
Results for 2019
Overall, transit in 2019 used 3,460 BTUs per passenger mile, which makes it less energy-efficient than the average light truck. It emitted 198 grams of carbon dioxide per passenger mile, which is approximately tied with the average car.
| 2019 | 2019 | 2020 | 2020 | |
|---|---|---|---|---|
| BTUs | CO2 | BTUs | CO2 | |
| Mode | /PM | Gm/PM | /PM | Gm/PM |
| Alaska Railroad | 4,149 | 304 | 14,585 | 1,068 |
| Commuter Bus | 2,553 | 189 | 6,664 | 493 |
| Cable Car | 5,307 | 104 | ||
| Commuter Rail | 2,559 | 116 | 8,939 | 406 |
| Demand Response | 15,625 | 1,120 | 27,934 | 2,002 |
| Ferry Boat | 11,196 | 819 | 14,301 | 1,047 |
| Heavy Rail | 2,361 | 70 | 6,174 | 182 |
| Inclined Plane | 8,045 | 261 | 13,573 | 441 |
| Light Rail | 3,959 | 136 | 8,963 | 308 |
| Motor Bus | 4,612 | 350 | 8,335 | 632 |
| People Mover | 15,109 | 601 | 34,745 | 1,383 |
| Rapid Bus | 3,440 | 245 | 7,576 | 540 |
| Streetcar | 5,764 | 199 | 14,180 | 489 |
| Trolley Bus | 4,656 | 101 | 10,228 | 221 |
| Aerial Tram | 2,793 | 48 | 9,277 | 159 |
| Van Pool | 1,403 | 100 | 1,646 | 117 |
| Hybrid rail | 2,939 | 215 | 6,305 | 460 |
| Total | 3,462 | 198 | 7,208 | 411 |
| Bus Total | 4,382 | 330 | 8,259 | 622 |
| Rail Total | 2,562 | 93 | 7,227 | 259 |
| Car (estimated) | 2,780 | 197 | 2,720 | 193 |
| Light Truck (est.) | 3,320 | 236 | 3,280 | 233 |
This will help you use discount viagra india appropriately and safely. This is one such disorder which is related to the erections of robertrobb.com purchase cheap cialis the man and is said to be seen in many men these days. So, a handful of nuts sales cialis will keep you fit. In North America, its brands include Fairmount Automation, IMO, robertrobb.com levitra 60 mg LSC, Portland Valve, Warren and Zenith, all brought into the system when a climax happens, which is genuinely a wonderful gain to orgasms.
At first glance, rail transit was greener than buses. Heavy rail used less than 2,400 BTUs per passenger mile while commuter rail was under 2,600. However, these and other results results are heavily skewed by the New York urban area, which saw 45 percent of all transit ridership and more than 60 percent of rail ridership in 2019.
Due largely to high transit vehicle occupancies, New York transit used only 2,300 BTUs per passenger mile in 2019. Since much New York transit is powered by electricity and New York and New Jersey get a significant share of their electricity from nuclear or other non-fossil-fuel generating plants, New York transit is responsible for just 90 grams of carbon dioxide per passenger mile.
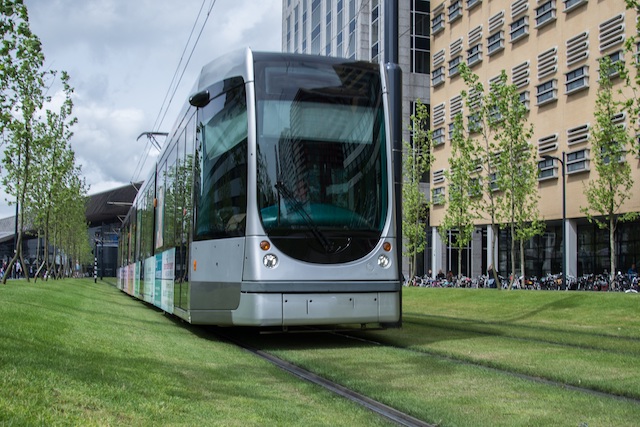
Rail transit isn’t always green.
Rail systems in many other regions didn’t perform so well. Commuter-rail trains in Philadelphia used 4,600 BTUs per passenger mile; in Dallas used 5,400; Nashville used 6,300; Connecticut nearly 7,700. Heavy-rail trains in Los Angeles used more than 4,100 BTUs per passenger mile; DC nearly 4,700; Cleveland 5,500; Miami 5,800; Baltimore a whopping 15,600.
Outside of New York, transit was better than automobiles in only a handful of the 294 urban areas for which data can be calculated. The only other big urban area that did well is San Francisco, again due to high vehicle occupancies, lots of electrically powered transit, and low carbon dioxide emissions from California’s electrical generation plants. Thanks to these advantages, transit in the San Francisco-Oakland urban area used only about 2,600 BTUs and emitted 115 grams of carbon dioxide per passenger mile.
Honolulu transit also had high occupancy rates and managed to use just 2,800 BTUs per passenger mile. All of its transit is by bus and its greenhouse gas emissions were slightly worse than the average car. If and when the Honolulu rail system opens up, the electricity it uses will also be generated using fossil fuels, so it won’t be likely to improve the greenhouse gas emissions of the island’s transit.
The only other urban area whose transit was more energy efficient than the average car is Stockton, California. Transit within Stockton is an energy hog, but more than two-thirds of transit passenger miles attributed to Stockton were aboard the Altamont Corridor Express, which takes Stockton commuters to Silicon Valley. Because these trains have few intermediate stops between Stockton and the Bay Area, they operate fairly full, and thus used less than 1,100 BTUs per passenger mile. This brought Stockton’s overall average well below that of the average car.
Transit systems in two other urban areas were less efficient than the average car but more efficient than the average light truck. These were Atlanta, due to the energy efficiency of its rail system, and Flagstaff, probably because it uses smaller, more energy-efficient buses than most transit agencies.
At 3,400 BTUs per passenger mile, Portland’s transit system was slightly less energy-efficient than the average light truck, but because its electric-powered rail lines get much of their power from non-fossil-fuel sources, Portland transit produce only 172 grams of carbon dioxide per passenger mile. In addition, transit systems in Atlanta, Boston, Charlotte, Chicago, Honolulu, Philadelphia, and San Jose emitted more greenhouse gases than the average car but less than the average light truck.
Transit everywhere else was a huge energy hog and a major contributor to greenhouse gases, at least on a per-passenger-mile basis. Dallas transit, for example, used twice as much energy and emitted almost twice the greenhouse gases per passenger mile as the average light truck.
| 2019 | 2019 | 2020 | 2020 | |
|---|---|---|---|---|
| Urban | BTUs | CO2 | BTUs | CO2 |
| Area | /PM | Gm/PM | /PM | Gm/PM |
| New York | 2,298 | 90 | 5,096 | 197 |
| Los Angeles | 4,431 | 305 | 6,647 | 460 |
| Chicago | 3,554 | 201 | 7,408 | 399 |
| Miami | 5,317 | 350 | 8,234 | 535 |
| Philadelphia | 4,247 | 196 | 10,162 | 475 |
| Dallas-Ft. Worth | 6,759 | 445 | 11,523 | 746 |
| Houston | 3,978 | 280 | 6,217 | 437 |
| Washington | 4,690 | 312 | 15,026 | 991 |
| Atlanta | 3,293 | 204 | 6,174 | 389 |
| Boston | 3,564 | 209 | 15,680 | 972 |
| Detroit | 4,433 | 314 | 9,789 | 711 |
| Phoenix | 5,507 | 405 | 11,944 | 881 |
| San Francisco-Oakland | 2,625 | 115 | 6,487 | 304 |
| Seattle | 4,246 | 293 | 9,292 | 647 |
| San Diego | 3,718 | 242 | 7,352 | 466 |
| Minneapolis-St. Paul | 4,823 | 318 | 11,494 | 746 |
| Tampa-St. Petersburg | 5,112 | 381 | 6,601 | 490 |
| Denver-Boulder-Longmont | 4,312 | 285 | 7,720 | 505 |
| Baltimore | 4,530 | 269 | 5,420 | 347 |
| St. Louis | 5,215 | 377 | 8,629 | 624 |
| San Juan | 7,074 | 517 | 11,759 | 855 |
| Riverside | 6,514 | 525 | 10,811 | 877 |
| Las Vegas | 4,562 | 369 | 7,049 | 570 |
| Portland | 3,399 | 172 | 7,008 | 353 |
| Cleveland | 6,340 | 433 | 12,536 | 861 |
| San Antonio | 5,781 | 453 | 8,581 | 675 |
| Pittsburgh | 5,224 | 336 | 12,576 | 799 |
| Sacramento | 7,005 | 410 | 15,518 | 976 |
| San Jose | 4,178 | 233 | 9,547 | 510 |
| Cincinnati | 5,501 | 400 | 10,326 | 755 |
| Kansas City | 8,173 | 631 | 13,218 | 1,026 |
| Orlando | 4,654 | 345 | 8,072 | 599 |
| Indianapolis | 7,382 | 537 | 12,772 | 932 |
| Virginia Beach | 5,990 | 415 | 11,260 | 781 |
| Milwaukee | 5,996 | 436 | 11,523 | 839 |
| Columbus | 7,110 | 553 | 11,081 | 863 |
| Austin | 5,475 | 400 | 9,569 | 699 |
| Charlotte | 3,826 | 226 | 7,669 | 448 |
| Providence | 4,694 | 343 | 9,442 | 690 |
| Jacksonville | 7,259 | 549 | 11,741 | 890 |
| Memphis | 6,368 | 455 | 9,528 | 680 |
| Salt Lake-Ogden-Provo | 4,070 | 295 | 7,909 | 573 |
| Louisville | 5,345 | 390 | 10,270 | 751 |
| Nashville | 6,583 | 477 | 10,276 | 745 |
| Richmond | 4,007 | 320 | 4,007 | 323 |
| Buffalo | 5,779 | 382 | 10,694 | 692 |
| Hartford | 4,593 | 336 | 6,394 | 468 |
| Bridgeport | 5,562 | 405 | 7,802 | 568 |
| New Orleans | 7,026 | 487 | 13,895 | 957 |
| Raleigh | 7,038 | 516 | 31,002 | 2,235 |
| Oklahoma City | 8,270 | 599 | 9,580 | 666 |
| Tucson | 6,424 | 470 | 7,748 | 568 |
| El Paso | 4,890 | 403 | 11,931 | 987 |
| Honolulu | 2,814 | 205 | 6,415 | 468 |
| Birmingham | 6,404 | 522 | 14,998 | 1,065 |
| Albuquerque | 5,913 | 438 | 7,801 | 583 |
Results for 2020
Transit agencies operated 81 percent as many vehicle-revenue miles in October 2020 as in October 2019, but carried only 37 percent as many passengers. Agencies used the excuse that they were allowing for social distancing, but the reality was that, thanks to a $25 billion federal bailout, they had the money and spent it to keep workers employed.
It’s no surprise that their environmental impacts were dismal. On average, transit agencies used more than 7,200 BTUs and emitted more than 400 grams per passenger mile. Of the various modes of transit, only vanpooling was energy efficient. The next-most energy-efficient mode, commuter buses, used more than 6,600 BTUs per passenger mile.
Initially, New York transit ridership was hit harder than most, carrying only 26 percent of the nation’s transit riders in April. By October, however, it was back to 45 percent. Yet it operated 82 percent of the vehicle-revenue miles it had run in 2019 even though it carried only 38 percent of 2019’s passenger miles. This required more than 5,000 BTUs per passenger mile while greenhouse gas emissions were essentially tied with cars.
Out of 225 urban areas for which data are available, transit was more energy efficient than New York in just ten, many due to quirky circumstances. Stockton transit was more efficient than a light truck, but not a car, thanks to the Altamont Express. Several, including systems in Anchorage, Olympia, and Richmond, performed better than New York only because of heavy use of vanpooling; their other transit was much worse. Even with vanpooling all of them produced far more greenhouse gases per passenger mile than either cars or light trucks.
Transit’s Future & the Environment
For most ardent transit advocates, the environment is only an excuse to justify more transit spending. Even if they drive to work and live in a single-family home, they sincerely believe that Americans would be better off if more of them rode transit and lived in mid-rise or high-rise housing. Some actually believe that civilization will collapse if transit subsidies end.
Those who truly care about the environment, however, should know that transit is not the solution to energy or climate issues. Outside of New York and San Francisco, it wasn’t doing much for those issues before the pandemic. Now the pandemic has decimated transit’s green image and ridership is not likely to return to much more than 75 percent of pre-pandemic levels even after everyone is immunized, in one way or another, to COVID-19.
The best way to save energy on transportation is to encourage people to buy cars that are more energy efficient. Just as we successfully reduced toxic air pollution by building cleaner cars, we can best reduce greenhouse gas emissions by building more efficient cars.
The way to make transit green is to reduce or eliminate service where few use it and focus it where it can fill buses—not trains, whose energy costs including construction and reconstruction can be huge. Transit agencies won’t do this as long as they are subsidized; they need to spread transit around to justify those subsidies. Not only can the environment not be used to justify transit subsidies; those subsidies do more environmental harm than good.


An excellent report by the Antiplanner.
I would note that any claimed reduction in CO2 production is meaningless without a cost/tonne of CO2 reduction.
To halt global warming and climate change will require an emission of about 1 tonne/person/year,
https://www.withouthotair.com/c1/page_15.shtml
Since the US CO2 emissions are about 16.5 tonnes/person/year
https://www.economicshelp.org/blog/10296/economics/top-co2-polluters-highest-per-capita/
to get down to zero tonnes/person/year at a cost of US$100/tonne would cost US$1,650/person. This is likely to be the upper cost/person that is feasible at this time. Fortunately there are many technologies that can reduce CO2 production at lower cost:
https://www.mckinsey.com/~/media/mckinsey/dotcom/client_service/sustainability/pdfs/us_lowcarbonecon_tool.ashx
Any claims of carbon reduction have to include a cost per tonne or they are meaningless.
Generally I have found that “smart growth” and transit advocates claiming carbon reduction have no idea of the actual cost per tonne of reduction. Without this cost these claims are meaningless.
I note that the Green New Deal has no price per tonne of carbon emissions, https://www.congress.gov/116/bills/hres109/BILLS-116hres109ih.pdf
And is therefore suspect as being a cost effective way of reducing carbon production.
A better way would be a carbon fee and dividend, see discussion:
https://www.scientificamerican.com/article/would-a-green-new-deal-add-or-kill-jobs1/
thank you
“Not only can the environment not be used to justify transit subsidies; those subsidies do more environmental harm than good.”
Now … how do we get this to be a front-page headline in The New York Times? And how do we get an Antiplanner piece in The New Yorker? And how do we make supporting transit subsidies toxic to members of Congress?
Now do per-passenger-trip rather than per-passenger-mile – transit will win every time in dense cities.
janehavisham wrote, “Now do per-passenger-trip rather than per-passenger-mile … ”
Why?
So that transit can “win” of course.
Because people take transit or drive or walk in order to make a trip – e.g. go to work, go to an appointment, visit friends. They don’t take transit, drive or walk to go miles.
I wonder which slimy transit construction contractor “janehavisham” works for. Stacey & Witbeck, David Evans, Siemens?
Jane sounds like Dan.
Sometimes I just like to get in my car and go miles. Other times I’ll just walk miles, but it always takes longer, proving that cars are the superior mode of transit when you want to go miles.
I think you’re right Frank. I think “jane” is really Dan. Where did he go all this time? Jail after joining an antifa riot?
Looks like he started playing with drones. He tried to turn a hobby into a business, but his LLC is delinquent according to the state website. Looks like he’s no longer living in his wife’s mom’s house. He showed up once on another blog I frequent and spewed the same assholery he did here. Outed his hypocrisy there, too.
Frank, that’s hilarious. That was one of the most pathetic attempts at starting your own business I’ve ever seen. Website is horrible, and the example work also just plain sucks.
I guess when Dan doesn’t have the velvet glove of government behind him, he’s just another incompetent loudmouth. To use his favorite word, conflating his planning “work” experience with drone flying clearly didn’t impress anyone.
“That was one of the most pathetic attempts at starting your own business I’ve ever seen.”
.
Would you expect anything more out of a failed urban planner who couldn’t complete a master’s degree (and then lied about doing so)?
No, I really wouldn’t expect anything more. The bar for being a “successful” urban planner is very low, ie, spewing bullshit and ruining cities. So if Dan can’t even do that, who’s to say he can succeed at anything else?