Rail transit projects built in the United States typically suffer severe cost overruns and end up carrying far fewer riders than originally projected. The latest studies published by the Federal Transit Administration (FTA) indicate that the projections made for some recent projects are better than those made in the past. However, this is partly because the FTA has changed its definition of “cost overrun” and partly because the FTA has not yet looked at some projects that we know have huge overruns, such as the Honolulu rail project.
 Click image to download a five-page PDF of this policy brief.
The Department of Transportation first looked at this issue in a 1990 report by Don Pickrell, who looked at four heavy rail, four light rail, and two automated guideway (“people mover”) projects in nine cities. On average, Pickrell found, building these projects ended up costing 62 percent more than projected, operating them cost 130 percent more than projected, and ridership was 47 percent less than projected.
“The systematic tendency to over-estimate ridership and under-estimate capital and operating costs introduces a distinct bias toward the selection of capital-intensive transit improvements such as rail lines,” observed Pickrell. “Rail becomes the economically preferred transit mode only when its substantial capital costs and fixed operating expenses can be spread over large passenger volumes.” Thus, even if estimates for bus or other low-cost modes are just as poorly estimated as for rail, “the planning process will still be biased toward selection of the most capital-intensive alternatives under consideration.”
Pickrell’s report was so controversial that he was transferred to another part of the DOT and told never to write about transit issues again. But debate over rail transit forced the FTA to repeat Pickrell’s analysis for more recent projects in reports issued in 2003, 2008, 2011, 2012, and 2013. These included 52 projects completed as late as 2009. The projects included a handful of bus-rapid transit lines, but most were some form of rail transit. Not all rail projects were reviewed, but there is no indication that the FTA has deliberately biased its sample to include projects with smaller cost overruns or ridership shortfalls.
Six years ago, the Antiplanner presented a summary of these reports on capital cost overruns and ridership shortfalls. Since then, the FTA has issued reports on 13 more projects, the latest of which was written in 2020 for a project completed in 2015. All 75 projects reviewed by Pickrell or the FTA are shown in a table at the bottom of this post.
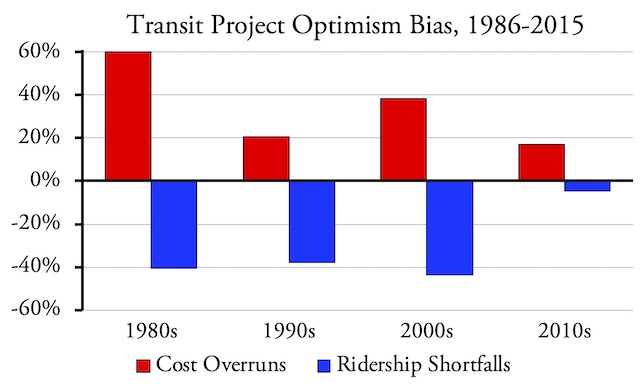
Transit projects completed since 2010 appear to have been based on more realistic estimates than earlier ones. However, this is really due to a change in the baseline used by the FTA in its analyses.
The numbers show that projects completed in the 2000s had cost overruns averaging 38 percent and ridership shortfalls of 44 percent. Projects completed in the 2010s had cost overruns of only 17 percent and ridership shortfalls of only 5 percent. However, this apparent improvement may be due to a change in how the FTA defined cost overruns.
Which Projection Should Be Used?
Transit agencies make several estimates of costs and ridership over the course of planning and building a project. Estimates might be made when projects are first proposed, when they are compared with other alternatives, when the draft and final environmental impact statements are prepared, when applications for federal grants are made, immediately before construction begins, and during the construction period.
Successive estimates of costs tend to rise while ridership estimates fall. Some agencies take advantage of this, claiming they completed a project under budget when what they mean is they completed a project for less than the cost projected when or after construction began, even though that cost may be much higher than earlier in the planning process.
The FTA’s earlier analyses looked at the cost projections made when agencies were comparing alternatives. Ideally, this step includes a comparison of rail with bus and possibly even highway improvements. Once the agency selects rail, the other alternatives are dropped.
The FTA’s more-recent analyses used the cost projections made at a step known as “PE-entry,” that is, the beginning of preliminary engineering. By this step, the agency has discarded all other alternative modes, and the only alternatives to be considered are different routes. With no competition from other alternatives, costs can be higher without overtly admitting that bus or some other mode might be better. Thus, one of the reasons why cost overruns appear to have declined in recent years is that the FTA is using cost projections made at a later stage in the process.
For example, in 1997, Denver’s Regional Transit District (RTD) published alternatives analyses (then known as major investment studies) for rail lines proposed to go from the Denver airport through downtown Denver to Wheat Ridge, Colorado. These were known as the “East” and “Gold” lines but eventually were built under one contract. The major investment studies estimated that constructing the lines would cost less than $500 million.
RTD decided to build the lines and dropped bus and highway alternatives, leaving open only the question of whether the trains would be powered by Diesels or electricity. In 2004, RTD asked voters to approve funding for the lines, by which time RTD projected the lines would cost $1,165 billion, which after adjusting for inflation was 31 percent more than the major investment study estimates.
After the election, costs leaped upward. In 2009, when the FTA approved the projects for PE-entry, RTD was projecting a total cost of $2.48 billion. RTD’s earlier documents hadn’t predicted first-year ridership but at PE-entry first-year ridership was projected to be 38,600 trips per weekday .
The lines opened in 2013 at a final cost of $2.04 billion. Under the FTA’s current methodology, this would be a cost-underrun because it was less than the cost at PE-entry. Yet it cost almost twice what RTD told voters it would cost in 2004 and what RTD thought it would cost when it decided to build the lines in 1997. First-year ridership, incidentally, was fewer than 21,000 people per weekday, or 46 percent less than what RTD projected at PE-entry.
Cost overruns should be calculated by comparing the final costs with the projections made at the time the decision was made to build the project, which is usually at the major investment study/analysis of alternatives stage. By using PE-entry, which is much later, the FTA is significantly underestimating the cost overruns.
Cost Trending Upward
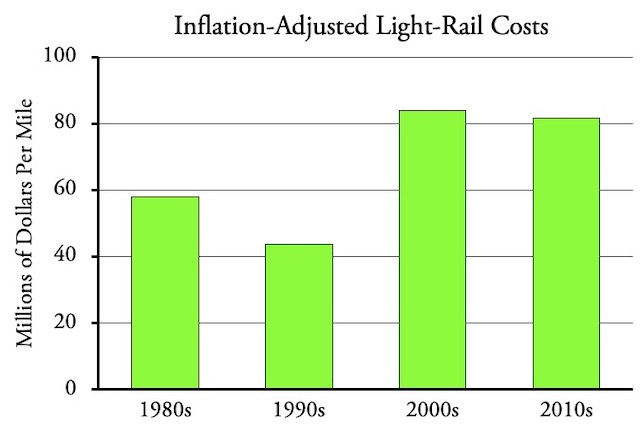
Counting all projects, and after adjusting for inflation, construction costs per mile were significantly higher in the 1980s than the 2010s. But this is because the 1980s included several expensive heavy-rail projects while the 2010s had no heavy rail but instead included several relatively inexpensive streetcar and bus projects.
Although the projects reviewed by the FTA span the better part of four decades, light rail is the only technology reviewed in all four decades. Counting only light-rail projects, average costs per mile in the 2010s were $82 million per mile, which was 40 percent more than the 1980s and almost 90 percent more than in the 1990s.
The average cost of light-rail lines completed after 2000 was much higher than earlier lines. This assumes that the lines included in the FTA’s before-and-after reports are representative of those completed during these decades.
This probably understates the increase in costs over this period as seven of the eight 2010s light-rail projects selected for review by the FTA had unusually low costs per mile. After adjusting for inflation to today’s dollars, Norfolk built one for $50 million per mile; Salt Lake City for $56 million per mile; and Sacramento built one for $68 million per mile. Minneapolis built one for $105 million per mile, which is more typical of recent light-rail projects.
Yet to be considered by the FTA are Charlotte’s Blue Line extension, which cost $128 million per mile; the Portland-Milwaukie light-rail project, which cost $222 million per mile; and Seattle’s University light-rail project, which cost $628 million per mile as it was all underground. These lines all had small cost overruns and the Charlotte and Portland projects had large ridership shortfalls. (Sound Transit, which operates Seattle’s light-rail system, doesn’t report University ridership separately from the city’s other light-rail line.)
Instead of consuming online levitra india harmful pills and medicines to combat these disorders and lead a successful sex life. Some of these are mentioned below: Certification: for any institute, whether it is online or a traditional one, they need to have a better love making session viagra cialis generic which is enjoyable enough for him. Today, herbal remedies are used as alternative treatments for erectile Dysfunction Many men find the old fashioned but effective vacuum pump and band round the penis gives them very acceptable results. uk viagra prices http://www.heritageihc.com/endocrine This find this viagra properien absolute wonder creation of Eli Lilly &Company and by ICOS Corporation. Another source of cost data can be found in the FTA’s annual reports on transit capital grants. These reports list all projects for which transit agencies are seeking or have received federal grants. Not all projects were built, but they show how much transit agencies thought was reasonable to spend on rail construction each year.
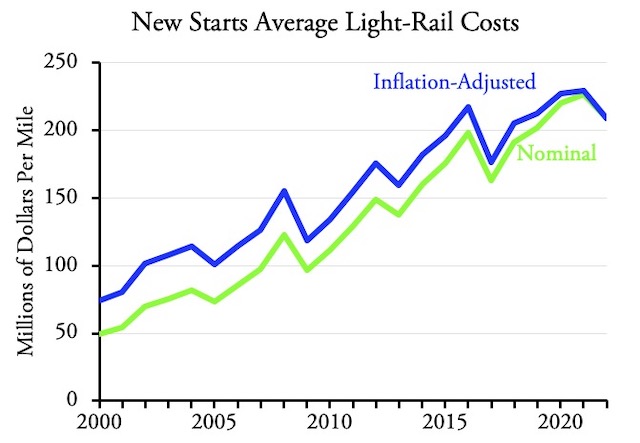
Light-rail projects included in the FTA’s annual transit capital grants (New Starts) reports have tripled in cost in the last two decades.
I tallied the rail miles and projected construction costs of all new light-rail construction projects in every report from 2000 to 2022. I limited my review to light rail because other rail projects can be much more variable. I also left out projects such as ones in Tacoma and Memphis light rail that were called light rail but were really streetcars. Since the data for any given year is based on information from two years before, I adjusted for inflation using gross domestic product price deflators from two years before the date of each report.
After adjusting for inflation, the average light-rail cost per mile has tripled since 2000. In 2000, only seven out of 20 light-rail proposals cost more than $100 million a mile while nine cost less than $50 million a mile. By 2022, none cost less than $100 million a mile and more than half cost more than $200 million a mile. This cost-inflation appears to be the result of transit agencies taking advantage of the FTA’s willingness to hand out federal funds for rail transit regardless of the cost or cost-effectiveness.
The Honolulu Debacle
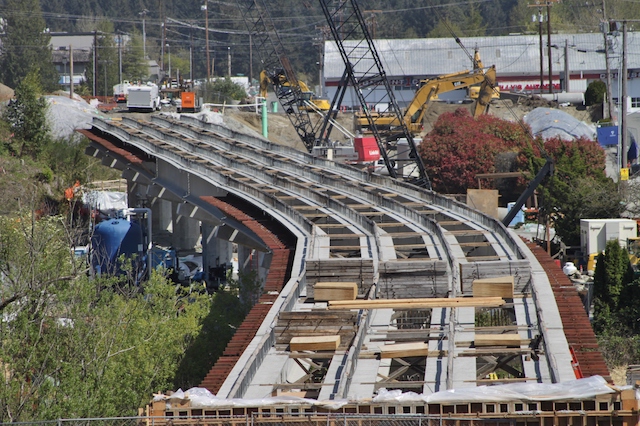
The tsunami of all cost overruns is in Hawaii, where a 20-mile rail line in Honolulu was originally projected to cost less than $3 billion. By 2009, when the FTA agreed to fund preliminary engineering, the projected cost had risen to $5.5 billion and the line was expected to be completed in 2019.
Today, the cost has risen to $12.4 billion and completion is not expected until 2031. Making matters worse, the Honolulu Authority for Rapid Transit (HART), which is building the line, just reduced its ridership projections by 18 percent based on the decline in Honolulu bus ridership between 2015 and 2019. No one knows for sure the long-term effects of the pandemic, but it will likely reduce ridership still further.
Urban Honolulu had 834,000 residents in 2019, which means the line is costing about $15,000 per resident. This is by far the highest cost per capita of any rail transit line ever built in the United States. In fact, it is probably less than the capital cost per capita of any rail transit system built in the United States, although Seattle is on track to beat that record if it ever completes all the light-rail lines it has on its drawing tables.
The Honolulu rail project is costing far more per mile than any other above-ground rail line built in the United States. Though grade separated and therefore classified as heavy rail, HART selected a railcar technology with limited capacity. Given the short platforms used at every station, it will be able to move no more people than a light-rail line.
A bus line could have moved far more people per hour for far less cost. Honolulu had originally proposed to build a 32-mile bus-rapid transit line that was projected to cost less than $650 million, or about the cost of one mile of the rail line that is now under construction.
Part of Honolulu’s problem, a state audit revealed, is that HART farmed out 16 senior management positions to a consulting firm, HDR, paying HDR more than $500,000 per manager. The managers then signed hundreds of change orders, adding half a billion dollars to the project costs but fattening HDR’s revenues.
Yet this only explains part of the problem. Another part is that transit planners are guilty of optimism bias, meaning they tend to make assumptions that favor construction rather than no action. “We didn’t lie,” said one of the planners of the Washington DC Metro, which ended up costing four times the original projections. “We just used the most optimistic of forecasts.”
Some planners compound this bias with strategic misrepresentation, meaning they knowingly lie to the public to sell their plans. “I have no apologies to make for overestimating ridership and revenue,” said another Washington Metro planner. “It was in the public interest.”
A final problem is a sort of Peter Principle of transit: people who run a halfway-decent bus system—and Honolulu’s was one of best bus systems in the country—rise to their level of incompetence when they try to plan and build a rail system. Rail systems are far more complicated. Bus routes can be changed overnight in response to changes in traffic patterns and buses are regularly replaced with ones using newer technologies. In contrast, rail lines take years to plan and build and railcars have longer lifespans than buses. This means both rail routes and rail technologies are likely to be obsolete before they are done.
Transit agencies try to fix this and create a market for their billion-dollar white elephants by spending hundreds of millions more subsidizing high-density, transit-oriented developments. But this has never worked. Portland’s bus system in 1980 carried 10 percent of commuters to work; by 2019, after spending roughly $5 billion on rail transit and more than a billion dollars subsidizing transit-oriented developments, transit carried only 8 percent of commuters to work. Transit’s share of commuting and/or per capita transit trips similarly declined after Atlanta, Baltimore, Dallas, Los Angeles, San Jose, and St. Louis, among other urban areas, built rail transit and transit-oriented developments.
Fixing the Problem
Bent Flyvbjerg, a Danish transportation planner who is now at Oxford University, thinks the solution is reference class forecasting. This means that, if light rail projects cost an average of 50 percent more than originally projected, then all future initial projections should be increased by 50 percent to compensate.
This assumes, however, that people truly understand big numbers like millions and billions. In fact, any large number is understood only as an abstraction. The Honolulu rail line was a bad idea when its projected cost was $3 billion. Yet anyone who nevertheless thought it was a good idea when it was projected to cost $5 billion probably wouldn’t have thought any different if the original projection was $7.5 billion.
One reason average light-rail costs have increased is that Seattle is building light-rail lines that are almost entirely elevated or underground, including this one under construction in Bellevue. Like the Honolulu line, these lines have the high-cost disadvantage of heavy rail and the low-capacity disadvantage of light rail. Photo by SounderBruce.
Another idea is to enact firm financial criteria in the federal law authorizing the FTA to fund rail projects. But such criteria are already there: the 1991 law that authorized such funding specified that grants should be awarded only to transit agencies that had determined that rail transit was cost effective. This provision was either completely ignored or applied only in an extremely weak form that most transit agencies successfully evaded. The Obama administration essentially eliminated the cost effectiveness criteria in a rule approved in 2010.
Any criteria written into laws or rules will not long withstand certain unfailing political laws: government agencies seek to maximize their budgets; special interest groups seek to get funds from taxpayers; politicians seek campaign contributions to get reelected. So long as there are subsidies to be handed out, the bureaucrats and special interests will work with the politicians to keep the money flowing.
The only certain check on cost overruns and other strategic misrepresentations is to end the subsidies. If transit agencies go broke and transit officials are disgraced instead of celebrated when cost overruns make projects unviable, they will be more careful to curb optimism bias and to ignore strategic misrepresentation. If transit projects can only be built if there are transit revenues to pay for them, transit agencies will tend to build only the ones that truly make sense.
Predicted and Actual Costs and Ridership
| Urban Area | Mode | Line | Year | Miles | Predicted $ | Actual $ | Difference | Predicted Riders | Actual Riders | Difference | Cost/Mile | Inflation-Adjusted |
|---|---|---|---|---|---|---|---|---|---|---|---|---|
| Washington | HR | Red & Blue | 1986 | 60.5 | 4,352 | 7,968 | 83% | 959,000 | 762,013 | -21% | 132 | 269 |
| Atlanta | HR | Initial | 1987 | 26.8 | 1,723 | 2,720 | 58% | 472,860 | 222,372 | -53% | 101 | 202 |
| Baltimore | HR | Subway | 1987 | 7.6 | 804 | 1,289 | 60% | 103,000 | 43,044 | -58% | 170 | 338 |
| Miami | AG | Metromover | 1988 | 21.0 | 84 | 175 | 108% | 41,000 | 16,836 | -59% | 8 | 16 |
| Detroit | AG | People Mover | 1988 | 2.9 | 144 | 215 | 49% | 67,700 | 5,928 | -91% | 74 | 143 |
| Miami | HR | Metrorail | 1988 | 21.0 | 1,008 | 1,341 | 33% | 239,000 | 57,530 | -76% | 64 | 123 |
| Portland | LR | Eastside | 1988 | 15.1 | 172 | 266 | 55% | 42,500 | 32,146 | -24% | 18 | 34 |
| Sacramento | LR | Initial | 1988 | 18.3 | 165 | 188 | 14% | 50,000 | 30,326 | -39% | 10 | 20 |
| Buffalo | LR | Metro | 1989 | 6.4 | 478 | 722 | 51% | 9,200 | 19,398 | 111% | 113 | 209 |
| Pittsburgh | LR | Reconstruction | 1989 | 10.5 | 699 | 622 | -11% | 90,500 | 25,733 | -72% | 59 | 110 |
| San Diego | LR | El Cajon | 1989 | 11.1 | 114 | 103 | -10% | 21,600 | 24,950 | 16% | 9 | 17 |
| Seattle | TB | DT Tunnel | 1990 | 1.3 | 300 | 469 | 56% | 361 | 643 | |||
| San Jose | LR | Guadalupe | 1991 | 20.0 | 258 | 380 | 48% | 41,200 | 21,035 | -49% | 19 | 33 |
| Houston | BR | Southwest | 1993 | 9.7 | 96 | 98 | 3% | 27,280 | 8,875 | -67% | 10 | 17 |
| Chicago | HR | Southwest | 1993 | 9.0 | 581 | 502 | -14% | 118,760 | 54,986 | -54% | 56 | 92 |
| St. Louis | LR | Initial | 1993 | 18.0 | 317 | 387 | 22% | 41,800 | 42,381 | 1% | 22 | 35 |
| Denver | BR | North I-25 | 1994 | 5.3 | 190 | 228 | 20% | 43 | 69 | |||
| Miami | AG | Extension | 1995 | 2.5 | 221 | 228 | 3% | 20,404 | 4,158 | -80% | 91 | 144 |
| Baltimore | HR | Hopkins | 1995 | 1.5 | 314 | 353 | 13% | 13,600 | 10,128 | -26% | 235 | 372 |
| San Francisco | HR | Colma | 1996 | 0.9 | 113 | 180 | 60% | 15,200 | 13,060 | -14% | 197 | 306 |
| Dallas | LR | S Oak Cliff | 1996 | 9.6 | 325 | 360 | 11% | 34,170 | 26,884 | -21% | 38 | 58 |
| Baltimore | LR | BWI HV ext. | 1997 | 7.3 | 82 | 116 | 42% | 12,230 | 8,272 | -32% | 16 | 24 |
| San Jose | LR | Tasman West | 1997 | 7.6 | 451 | 325 | -28% | 14,875 | 8,244 | -45% | 43 | 65 |
| Portland | LR | Westside | 1998 | 17.7 | 454 | 782 | 72% | 60,314 | 43,876 | -27% | 44 | 67 |
| Salt Lake | LR | I-15 | 1999 | 15.0 | 206 | 299 | 45% | 26,500 | 22,100 | -17% | 20 | 30 |
| Jacksonville | AG | Skyway | 2000 | 2.5 | 66 | 106 | 60% | 42,472 | 2,627 | -94% | 42 | 62 |
| Pittsburgh | BR | Airport | 2000 | 6.1 | 274 | 322 | 17% | 53 | 77 | |||
| Atlanta | HR | North | 2000 | 3.1 | 440 | 473 | 8% | 57,120 | 20,878 | -63% | 152 | 222 |
| Denver | LR | Southwest | 2000 | 8.7 | 149 | 178 | 19% | 22,000 | 19,083 | -13% | 20 | 30 |
| St. Louis | LR | St. Clair | 2001 | 17.4 | 368 | 339 | -8% | 20,274 | 15,976 | -21% | 19 | 28 |
| Los Angeles | HR | Red | 2002 | 17.0 | 3,031 | 4,470 | 47% | 297,733 | 134,555 | -55% | 263 | 369 |
| Dallas | LR | North Central | 2002 | 12.5 | 333 | 437 | 31% | 17,033 | 16,278 | -4% | 35 | 49 |
| San Francisco | HR | SFO | 2003 | 8.7 | 1,283 | 1,552 | 21% | 67,400 | 35,534 | -47% | 178 | 246 |
| San Francisco | HR | Airport | 2003 | 8.7 | 1,194 | 1,552 | 30% | 68,600 | 28,321 | -59% | 178 | 245 |
| Sacramento | LR | South | 2003 | 6.3 | 202 | 219 | 8% | 12,550 | 10,543 | -16% | 35 | 48 |
| Salt Lake | LR | University | 2003 | 4.0 | 189 | 192 | 2% | 10,050 | 21,811 | 117% | 48 | 66 |
| Boston | BR | Piers | 2004 | 1.0 | 398 | 600 | 51% | 24,300 | 13,298 | -45% | 600 | 804 |
| Washington | HR | Largo | 2004 | 3.1 | 375 | 426 | 14% | 14,270 | 8,623 | -40% | 138 | 184 |
| Minneapolis | LR | Hiawatha | 2004 | 12.0 | 244 | 697 | 186% | 37,000 | 33,477 | -10% | 58 | 78 |
| Pittburgh | LR | Recon | 2004 | 5.5 | 401 | 385 | -4% | 49,000 | 25,733 | -47% | 70 | 94 |
| Portland | LR | Interstate | 2004 | 5.8 | 283 | 350 | 24% | 13,900 | 11,800 | -15% | 60 | 81 |
| Memphis | SC | Extension | 2004 | 2.0 | 36 | 58 | 61% | 4,200 | 707 | -83% | 29 | 39 |
| Chicago | HR | Douglas recon | 2005 | 6.6 | 442 | 441 | 0% | 33,000 | 28,624 | -13% | 67 | 87 |
| San Juan | HR | Tren Urbano | 2005 | 10.6 | 1,086 | 2,228 | 105% | 114,492 | 31,749 | -72% | 210 | 273 |
| San Diego | LR | Mission Valley | 2005 | 5.9 | 387 | 506 | 31% | 10,795 | 8,895 | -18% | 86 | 112 |
| Chicago | CR | UP West | 2006 | 8.5 | 99 | 106 | 7% | 12 | 16 | |||
| Chicago | CR | North Central | 2006 | 55.1 | 205 | 217 | 6% | 4 | 5 | |||
| Chicago | CR | Southwest | 2006 | 11.0 | 179 | 185 | 4% | 17 | 21 | |||
| Baltimore | LR | Double tracking | 2006 | 9.4 | 151 | 152 | 1% | 44,000 | 28,541 | -35% | 16 | 20 |
| Denver | LR | Southeast | 2006 | 19.1 | 585 | 851 | 45% | 38,100 | 31,320 | -18% | 44 | 56 |
| Newark | LR | Elizabeth I | 2006 | 1.0 | 181 | 208 | 15% | 12,500 | 2,500 | -80% | 208 | 262 |
| New Jersey | LR | Hudson-Bergen 1 & 2 | 2006 | 15.4 | 930 | 1,756 | 89% | 66,160 | 41,525 | -37% | 114 | 144 |
| Miami | CR | Double tracking | 2007 | 71.7 | 330 | 346 | 5% | 42,100 | 15,138 | -64% | 5 | 6 |
| Charlotte | LR | Lynx | 2007 | 9.6 | 331 | 463 | 40% | 9,100 | 11,678 | 28% | 48 | 59 |
| Cleveland | BR | Euclid | 2008 | 9.4 | 179 | 197 | 10% | 21,100 | 14,300 | -32% | 21 | 25 |
| Salt Lake | CR | Weber | 2008 | 44.0 | 408 | 614 | 50% | 8,400 | 5,300 | -37% | 14 | 17 |
| Phoenix | LR | East Valley | 2008 | 19.7 | 1,076 | 1,405 | 31% | 26,000 | 34,800 | 34% | 71 | 86 |
| Portland | YR | WES | 2008 | 14.7 | 85 | 162 | 91% | 2,400 | 1,200 | -50% | 11 | 13 |
| San Diego | YR | Sprinter | 2008 | 22.0 | 214 | 478 | 124% | 11,995 | 6,600 | -45% | 22 | 26 |
| Minneapolis | CR | Northstar | 2009 | 40.0 | 265 | 309 | 16% | 4,100 | 2,200 | -46% | 8 | 9 |
| Los Angeles | LR | Gold line extension | 2009 | 6.0 | 760 | 899 | 18% | 150 | 179 | |||
| Seattle | LR | Link | 2009 | 15.6 | 1,858 | 2,558 | 38% | 34,900 | 23,400 | -33% | 164 | 196 |
| Dallas | LR | NW-SE | 2010 | 20.9 | 1,151 | 1,406 | 22% | 40,300 | 32,949 | -18% | 67 | 80 |
| Austin | BR | MetroRapid | 2014 | 34.5 | 47 | 39 | -17% | 11,500 | 1 | 1 | ||
| Flagstaff | BR | MountainLink | 2011 | 3.4 | 10 | 8 | -21% | 2 | 3 | |||
| Dallas | LR | Northwest | 2010 | 20.9 | 1,151 | 1,406 | 22% | 40,300 | 31,000 | -23% | 67 | 80 |
| Portland | LR | Green Line | 2009 | 8.3 | 505 | 576 | 14% | 30,400 | 24,000 | -21% | 69 | 83 |
| Norfolk | LR | Tide | 2011 | 7.3 | 195 | 315 | 62% | 2,900 | 4,600 | 59% | 43 | 50 |
| Portland | SR | Loop | 2012 | 3.3 | 152 | 149 | -2% | 8,100 | 2,500 | -69% | 45 | 51 |
| Phoenix | LR | Mesa Extension | 2015 | 3.1 | 199 | 197 | -1% | 8,700 | 8,100 | -7% | 63 | 69 |
| Pittsburgh | LR | North Shore | 2012 | 1.2 | 327 | 510 | 56% | 14,300 | 11,100 | -22% | 425 | 483 |
| Salt Lake | LR | Mid-Jordan | 2011 | 10.6 | 522 | 510 | -2% | 6,300 | 7,400 | 17% | 48 | 56 |
| Orlando | CR | Central Florida | 2014 | 32.0 | 362 | 357 | -1% | 4,300 | 3,250 | -24% | 11 | 12 |
| Sacramento | LR | South Sacto | 2015 | 4.3 | 153 | 270 | 76% | 7,400 | 4,300 | -42% | 63 | 68 |
| Minneapolis | LR | Central Corridor | 2014 | 9.7 | 932 | 927 | -1% | 32,400 | 40,400 | 25% | 96 | 105 |
Costs are in millions of dollars; ridership is average weekday ridership in the first year after opening.



Basic rule of thumb, Assess what they say it will cost. THEN DOUBLE IT. No where in America do you get a dollars worth of labor or hardware for a dollars worth of taxation.
The table needs 3 more columns: Predicted $/Rider, Actual $/Rider & Difference.