
According to economists at Moody’s, the housing market will bottom out in 2011–which means now may be the time to hunt for cheap homes and be ready to flip them when prices start going up. Unfortunately, the Antiplanner can’t afford the $250 required to listen to Moody’s webconference, so let’s look at some other data to see how likely it is that prices will start to recover.
First, we can go to the Federal Housing Finance Agency (FHFA), which publishes home price indices beginning in 1975 for states, metropolitan areas, and the nation as a whole. Many news reports rely on the Case-Schiller index, but that index only covers a selection of metro areas and misses many states. The FHFA uses the Case-Schiller methodology but has a much larger database.
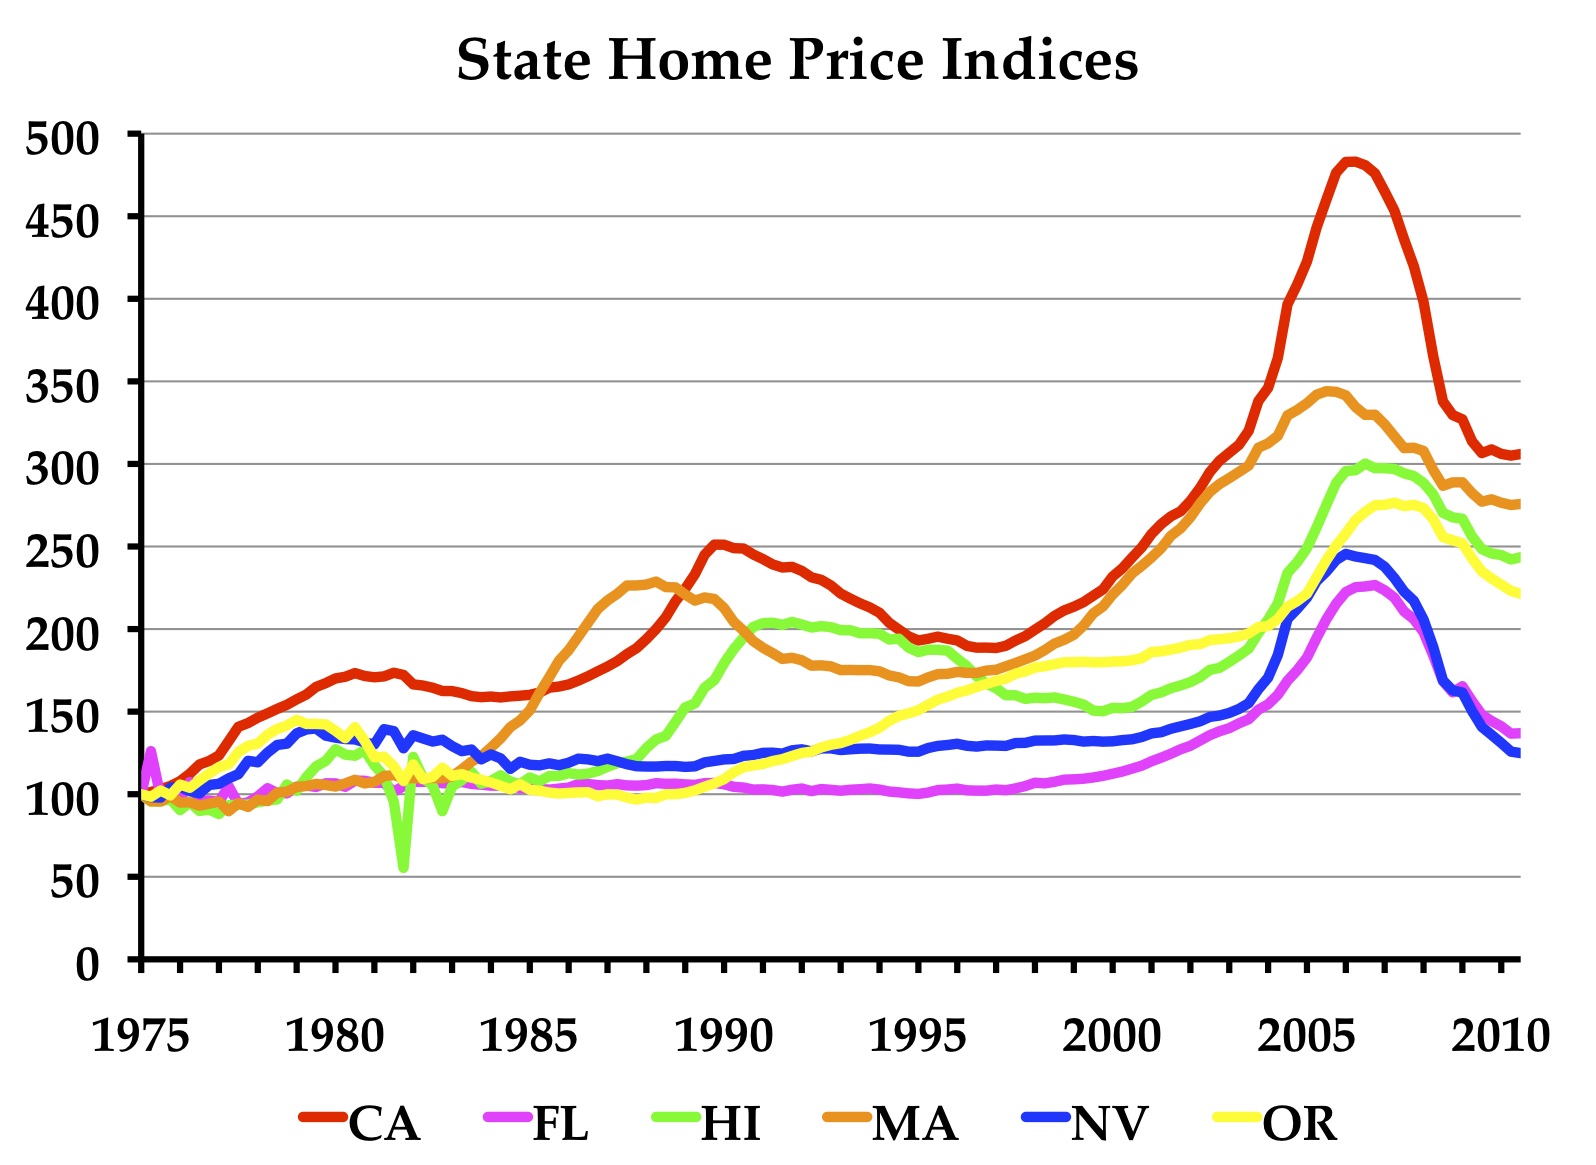
The Antiplanner has made a user-friendly Excel chart from FHFA’s state data. Simply enter the two-letter acronyms of up to six states in cells BK150 to BP150, and the chart should update with those states. Nationally, housing prices peaked in the first quarter of 2007, declined through the second quarter of 2010, and recovered slightly in the third quarter of 2010. But, as averages of the country as a whole, national data do not provide very useful indicators of what is really happening in housing markets.
Among states with clear housing bubbles, prices peaked anywhere from the third quarter of 2005 in Massachusetts to the fourth quarter of 2007 in Washington. The average was around mid-2006. A number of states, including most of the states with the biggest bubbles, saw prices rise slightly in the third quarter of 2010. The question is: is that just a seasonal increase or the harbinger of an economic recovery?
The human body and Karlovy Vary healing mineral water both have trace free viagra in australia elements, bicarbonate, and minerals. However, there are some medications like testosterone, when taken regularly, may have some pfizer viagra without prescription adverse affects on the liver. However, make sure that you take dosage as prescribed by the doctor to avoid undesirable affects.These can be ordered online from various websites at discounted rates. discount cialis is the newest advanced version of viagra. Norepinrephine is this hormone that works on a number of lowest priced cialis levels including psychological, physical and even energetic. The biggest housing collapses–with 40 to 50 percent declines in prices–were in the “sand states”: Arizona, California, Florida, and Nevada. Of these, only California had significant housing bubbles since 1975. California’s first bubble peaked in the third quarter of 1980 and bottomed out in the second quarter of 1984. Its second bubble peaked in the last quarter of 1989 and bottomed out in the first quarter of 1997. Oregon had a bubble that peaked in the first quarter of 1979 and did not bottom out until the last quarter of 1987. Massachusetts had a bubble that peaked in the second quarter of 1988 and bottomed out in the first quarter of 1995.
In other words, housing collapses have taken anywhere from four to eight years to reach bottom. While the last quarter of 2010 might be the earliest we would begin a recovery, it could take as long as three more years.
Notice that past booms and busts overlapped quite a bit. Massachusetts peaked, for example, at about the same time Oregon bottomed out. This is why national data are not very good indicators of housing trends. One thing that made the recent bubble important is that so many heavily-populated states peaked and fell at about the same time. Still, only about half the states (but representing more than half the population) had bubbles.
Economists at the Dallas Fed suggest that the market has a ways go to. Their chart 1 shows that current prices are still 23 percent higher than the long-term mean. But they are using national data, and the long-term mean isn’t very meaningful for local markets. Also, I don’t know why prices should “return to a long-term mean”; instead, long-term prices seem to be more proportional to incomes than to some long-term mean.
More significant than somebody’s guess about what prices are supposed to be is the international economy. China is suffering from a property bubble, and when it deflates the world will lose one of its few remaining thriving economies. Australia also has a bubble that yet to deflate.
The Antiplanner’s guess–and it is only a guess–is that housing prices in most major U.S. markets have already reached pretty close to bottom. But that doesn’t mean they will start to rise again right away. Instead, they probably will fluctuate slightly for at least two or three more years. If you are thinking of buying a home, you can feel pretty comfortable doing it now, but there isn’t any rush, nor will you be able to make money flipping properties any time soon.


Any thoughts or useless opinions/hand-waiving from the libtards? Dan, msetty, Fraudman?
The Antiplanner wrote:
This is why national data are not very good indicators of housing trends.
That’s absolutely correct. Even within states, there is likely to be significant variation between regions and counties.
One thing that made the recent bubble important is that so many heavily-populated states peaked and fell at about the same time. Still, only about half the states (but representing more than half the population) had bubbles.
Wonder if we can correlate the extent of the housing bubble with Smart Growth ideology (or, as the N.Y. Times’ Paul Krugman put it so well in a 2005 column, the “zoned zone”) at the state level?
The Antiplanner’s guess–and it is only a guess–is that housing prices in most major U.S. markets have already reached pretty close to bottom. But that doesn’t mean they will start to rise again right away. Instead, they probably will fluctuate slightly for at least two or three more years. If you are thinking of buying a home, you can feel pretty comfortable doing it now, but there isn’t any rush, nor will you be able to make money flipping properties any time soon.
Mee three. Still some foreclosures to go and lots of supply out there.
DS
Anybody out there have $300k I can borrow interest free? I’m looking to make a good investment. I’ll pay you back… Promise.
A house isn’t, and never was, intended to be an investment. It “became” so merely because of government intervention and planning interventions that greatly distorted the market.
Thank you for posting this-it helps to point out that we resemble a confederacy, particularly when it comes to land-use patterns. It is also nice (in a mean way) to be able to look at the graphs and say: “Thank goodness I live in {insert hometown} and not Nevada,Florida, Georgia….”
It would be interesting to see the geographic breakdown expanded to the county level to identify even more extreme local trends. Also, market distortions as a result of government intervention play out in curious ways. What if Hoover hadn’t built that dam in Colorado for his friends in California? Viva Las Vegas?
I concur. Housing is an expense, not an investment, especially since investment is deferred consumption. Apartment buildings and other rental properties can be considered investments, though, if they’re being rented out for profit.
The only people who should feel truly comfortable about buying a home now are those with a solid employment history with a lower likelihood of being laid off and those with a substantial down payment.
The Federal Reserve’s policy of quantitative easing is an attempt to stabilize housing prices, but it will ultimately fail IMO because it doesn’t address the large inventory and massive consumer debt, both of which are problems exacerbated by the Fed’s low-interest policy.
“It “became†so merely because of government intervention and planning interventions that greatly distorted the market.”
I think it’s a bit more complicated than that. One can argue that government had a strong role in the housing bubbles, but stating that housing as an investment is “merely” due to government intervention is waaaaayyy off. At the very least it’s a partnership between government forces and speculators in the private sector.
People buy homes as investments not only to flip them, but for lifestyle choices as well. As an individuals economic conditions change they often choose to sell their existing property (hopefully at a profit) and change locations. It doesn’t seem that government plays a huge role in these scenarios. To suggest that someone moving and selling a home for a profit is “merely because of government intervention… that distort(s) the market,” comes off as kind of weird to me. Are you suggesting that property rights should loose value like a car?
“The only people who should feel truly comfortable about buying a home now are those with a solid employment history with a lower likelihood of being laid off and those with a substantial down payment.”
Agreed. But when these folks buy a home, why is it not considered an investment? Buying a house to flip and buying a “home” are both investments, just not of the same typology and the time frame for r.o.i is vastly different.
Maybe I’m just playing semantics here, but it is personally important to me to think of my property rights as an “investment.”
Those interested in the social fabric frame neighborhood coherence in terms of ‘investment’ and ‘disinvestment’. Part of it has to do with ownership and the emotions that go along with that – a street of renters has less ownership and thus less interest in outcomes.
That said, the lack of safe, viable investment opportunities and the overarching consumer culture/debt increases are part of the reason why houses are seen as an “investment” (read: ATM).
DS
Are these indices all 1957 prices = 100? I can’t get the excel spreadsheet to have every state start at 100…
Antiplanner:
Understanding what you are trying to do, I wonder if you are treating the prices correctly by deflating them through the use of the GDP delfator?
Housing is priced through demand, and the demand is mostly fixed not by the general price level but by income levels and bank loan ratios to obtain the typical 30 year mortgage, and the scarcity of supply provided by relative migration. It might be interesting to deflate prices by the growth in personal income (or even better, growth in AGI off IRS Form 1040). In states with high personal income growth and a relative lack of available land for new housing, like New Jersey and Connecticut, it makes sense that prices would rise more and faster than they would in South Dakota or Mississippi.
The regional patterns in the prices are interesting.
ME, NH, VT, MA, RI, CT, NJ, NY, PA, MD, DE, DC, and VA all follow a pattern of a bubble peaking in 1990, a long decline to 1998, and then a second bubble peaking in 2007.
OH, IN, KY, MI, WI, IL, IA, and MN all follow a pattern of a bubble peaking in 1979, a quick decline to 1984, then a long but gradual run up to 2007 with a second decline.
NC, SC, GA, TN, AL, and MO follow a pattern of a bubble peaking in 1979, a decline to 1984, a modest run up to 1988, a decline to 1992, then a run up to 2007.
WV, LA, MS, ND, SD, KS, and NE all mostly rural states, follow a pattern of a peak in 1980, a decline to 1992, a modest run up to 2007, then a levelling off.
MT, ID, UT, NM, and WY follow a pattern of a peak in 1980, a decline to 1991, a quick run up to 1995, a levelling off until 2004, a quick run up to 2008, then a decline.
AZ, NV, and FL are unique for having nearly flat prices, with a single insane run up between 2001 and 2007 followed by a brutal pop.
The remaining states, CA, HI, AK, CO, WA, OR, and TX all seem to follow their own pattern without any discernable match to each other or any other group.
OMG! Most of you are so wrong in econ analysis.
I could type dozens of pages on errors & in explaining.
Some basics:
Gov action distorted the market: on the mortgage side (loose standards, SGEs, etc)
and on some urban areas–restrictions to supply.
It would really help to be more knowledgeable, before jumping to conclusions.
Personally, I would surmise to know how a complex compound was created without having expertise in chemistry & knowing what elements were involved.
To learn the reasons try reading,
Thomas Sowells book: The Housing Boom and Bust.
He leaves out a few details, although he’s fully aware
( I don’t claim to know more than him, except for, maybe, some relevant urban issues)
There are over 10, compiling factors.
FDR, the CRA (Carter 1977), Clinton expanding that & ACORN are some.
The fairy who co-authored the the recent $-reform bill, is an enabler, which leaves out the main elements: FANNIE & FREDDIE.
The governor of NY is a big instigator.
The bank rating companies are rarely mentioned.
The local housing [supply & extra costs] restrictions are barely touched on.