Americans drove 89.7 percent as many miles in December 2020 as they did in December 2019, according to data released yesterday by the Federal Highway Administration. This compares with transit and air travel, which were each about 37.5 percent of 2019 levels, and Amtrak, which was 22.4 percent of 2019. These numbers continue to demonstrate that motor vehicles and highways are the most resilient forms of travel we have.
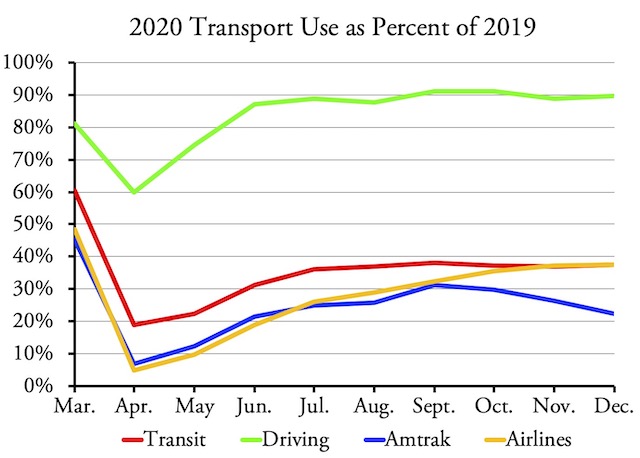
This is an update of a chart that appeared in a recent Antiplanner policy brief. In that brief, I estimated that December driving would be 89 percent of 2019 levels, but it turned out to be a little higher.
Driving was down more in urban areas than in rural areas and it was down more on interstate highways, both urban and rural, and the least on collectors and local roads and streets. The biggest drops in driving were in Hawaii (-20.2%), Vermont (-20.2%), Massachusetts (-18.0%), Minnesota (-17.8%), and New Jersey (-17.7%). The smallest declines were in Arkansas (-0.9%), Tennessee (-2.5%), Wyoming (-2.8%), Arizona (-3.5%), and Mississippi (-3.6%). Surprisingly, California saw only a 9.9 percent drop (10.9% in urban areas), probably because all of the people who are supposedly working at home are driving to coffee shops and other places in the afternoons. Continue reading →


