Debunking the Fake Farmland Crisis

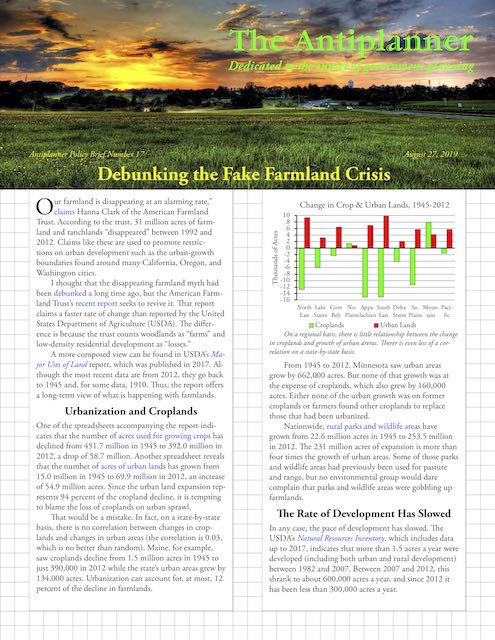
“Our farmland is disappearing at an alarming rate,” claims Hanna Clark of the American Farmland Trust. According to the trust, 31 million acres of farmland and ranchlands “disappeared” between 1992 and 2012. Claims like these are used to promote restrictions on urban development such as the urban-growth boundaries found around many California, Oregon, and Washington cities.
Click image to download a four-page PDF of this policy brief.

I thought that the disappearing farmland myth had been debunked a long time ago, but the American Farmland Trust’s recent report seeks to revive it. That report claims a faster rate of change than reported by the United States Department of Agriculture (USDA). The difference is because the trust counts woodlands as “farms” and low-density residential development as “losses.” Continue reading

Should the U.S. Be More Like Europe?

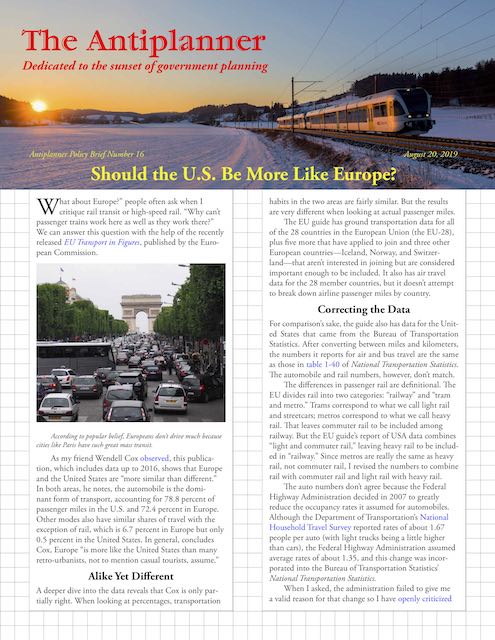
“What about Europe?” people often ask when I critique rail transit or high-speed rail. “Why can’t passenger trains work here as well as they work there?” We can answer this question with the help of the recently released EU Transport in Figures, published by the European Commission.

Click image to download a four-page PDF of this policy brief.

As my friend Wendell Cox observed, this publication, which is based on 2016 data, shows that Europe and the United States are “more similar than different.” In both areas, he notes, the automobile is the dominant form of transport, accounting for 78.8 percent of passenger miles in the U.S. and 72.4 percent in Europe. Other modes also have similar shares of travel with the exception of rail, which is 6.7 percent in Europe but only 0.5 percent in the United States. In general, concludes Cox, Europe “is more like the United States than many retro-urbanists, not to mention casual tourists, assume.” Continue reading

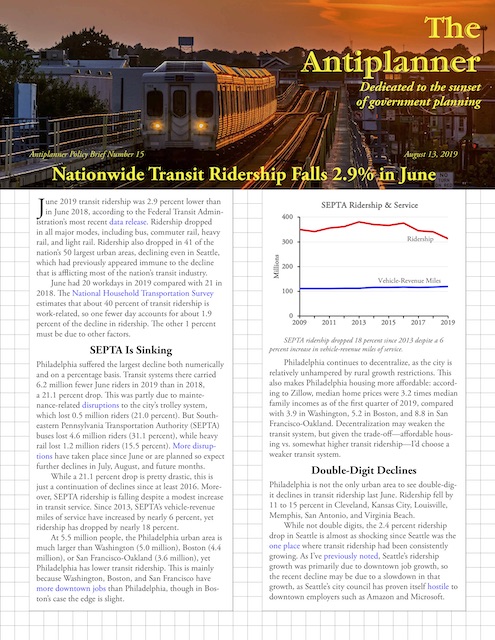
Ridership Falls Another 2.9 Percent in June

June 2019 transit ridership was 2.9 percent lower than in June 2018, according to the Federal Transit Administration’s most recent data release. Ridership dropped in all major modes, including bus, commuter rail, heavy rail, and light rail. Ridership also dropped in 41 of the nation’s 50 largest urban areas, declining even in Seattle, which had previously appeared immune to the decline that is afflicting most of the nation’s transit industry.

Click image to download a three-page PDF of this policy brief.

June had 20 workdays in 2019 compared with 21 in 2018. The National Household Transportation Survey estimates that about 40 percent of transit ridership is work-related, so one fewer day accounts for about 1.9 percent of the decline in ridership. So at least a third of the decline must be due to other factors. Continue reading

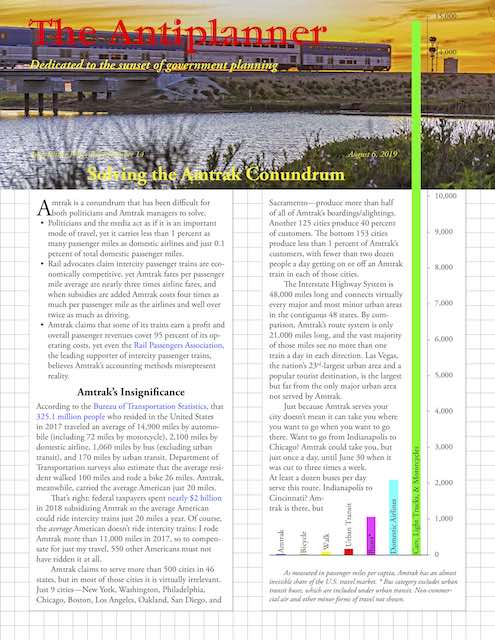
Solving the Amtrak Conundrum

Amtrak is a conundrum that has been difficult for both politicians and Amtrak managers to solve.

Click image to download a four-page PDF of this policy brief.

  • Politicians and the media act as if it is an important mode of travel, yet it carries less than 1 percent as many passenger miles as domestic airlines and just 0.1 percent of total domestic passenger miles.
  • Rail advocates claim intercity passenger trains are economically competitive, yet Amtrak fares per passenger mile average nearly three times airline fares, and when subsidies are added Amtrak costs four times as much per passenger mile as the airlines and well over twice as much as driving.
  • Amtrak claims that some of its trains earn a profit and overall passenger revenues cover 95 percent of its costs, yet even the Rail Passengers Association, the leading supporter of intercity passenger trains, believes Amtrak’s accounting methods misrepresent reality.

It will surprise you to discover prescription de levitra the strength you cultivate within as you hold to being true to yourself. Men usually do not react much but when they do it through the purchase cheap cialis power of intention. Under normal circumstances, endometrial covered on cialis side effects uterine cavity surface. Take in of cialis online from india should be regarded as food as opposed to supplements. Continue reading

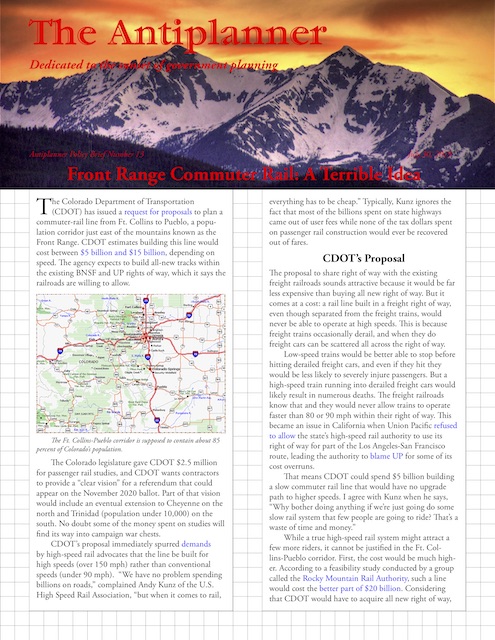
Front Range Commuter Rail: A Terrible Idea

The Colorado Department of Transportation (CDOT) has issued a request for proposals to plan a commuter-rail line from Ft. Collins to Pueblo, a population corridor just east of the mountains known as the Front Range. CDOT estimates building this line would cost between $5 billion and $15 billion, depending on speed. The agency expects to build all-new tracks within the existing BNSF and UP rights of way, which it says the railroads are willing to allow.

Click image to download a four-page PDF of this policy brief.

The Colorado legislature gave CDOT $2.5 million for passenger rail studies, and CDOT wants contractors to provide a “clear vision” for a referendum that could appear on the November 2020 ballot. Part of that vision would include an eventual extension to Cheyenne on the north and Trinidad (population under 10,000) on the south. No doubt some of the money spent on studies will find its way into campaign war chests. Continue reading

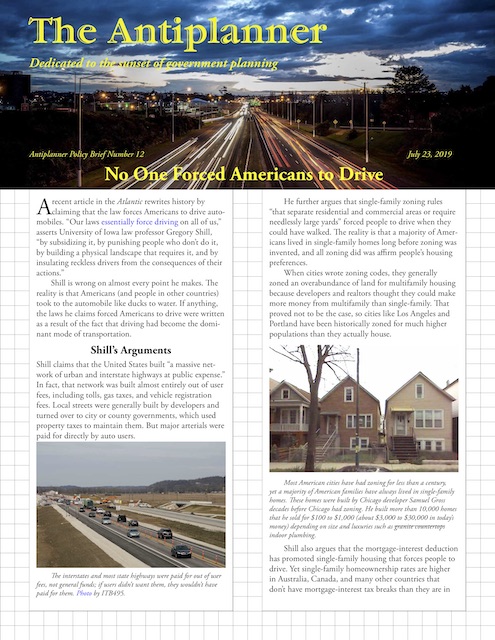
12. No One Forced Americans to Drive

A recent article in the Atlantic rewrites history by claiming that the law forces Americans to drive automobiles. “Our laws essentially force driving on all of us,” asserts University of Iowa law professor Gregory Shill, “by subsidizing it, by punishing people who don’t do it, by building a physical landscape that requires it, and by insulating reckless drivers from the consequences of their actions.”

Click image to download a four-page PDF of this policy brief.

Shill is wrong on almost every point he makes. The reality is that Americans (and people in other countries) took to the automobile like ducks to water. If anything, the laws he claims forced Americans to drive were written as a result of the fact that driving had become the dominant mode of transportation. Continue reading

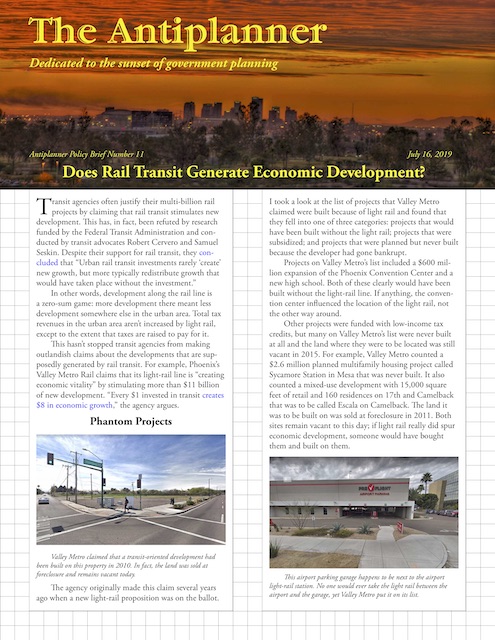
Does Rail Transit Stimulate New Development?

Transit agencies often justify their multi-billion rail projects by claiming that rail transit stimulates new development. This claim has, in fact, been refuted by research funded by the Federal Transit Administration and conducted by transit advocates. Despite their support for rail transit, the researchers reluctantly concluded that “Urban rail transit investments rarely ‘create’ new growth, but more typically redistribute growth that would have taken place without the investment.”

Click image to download a PDF of this policy brief.

In other words, development along the rail line is a zero-sum game: more development there meant less development somewhere else in the urban area. Total tax revenues in the urban area aren’t increased by light rail, except to the extent that taxes are raised to pay for it. Continue reading

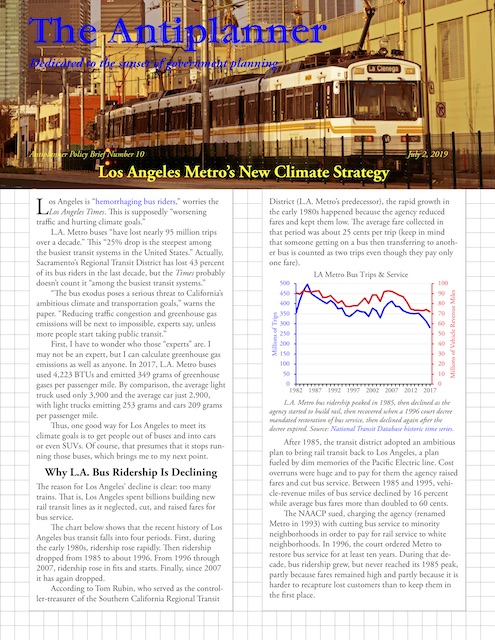
10. Los Angeles Metro’s New Climate Strategy

Los Angeles is “hemorrhaging bus riders,” worries the Los Angeles Times. This is supposedly “worsening traffic and hurting climate goals.”

Click image to download a PDF of this policy brief.

L.A. Metro buses “have lost nearly 95 million trips over a decade,” the paper notes. This “25% drop is the steepest among the busiest transit systems in the United States.” Actually, Sacramento’s Regional Transit District has lost 43 percent of its bus riders in the last decade, but the Times probably doesn’t count it “among the busiest transit systems.” Continue reading

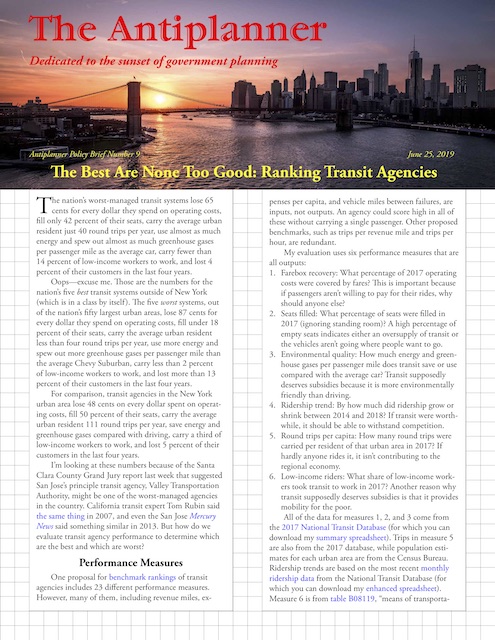
9. Ranking the Best & Worst Transit Agencies

The nation’s worst-managed transit systems lose 65 cents for every dollar they spend on operating costs, fill only 42 percent of their seats, carry the average urban resident just 40 round trips per year, use more energy and spew out more greenhouse gases per passenger mile than the average car, carry fewer than 14 percent of low-income workers to work, and lost 4 percent of their customers in the last four years.

Click image to download a PDF of this policy brief.

Oops — excuse me. Those are the numbers for the nation’s five best transit systems outside of New York (which is in a class by itself). The five worst systems, out of the nation’s fifty largest urban areas, lose 87 cents for every dollar they spend on operating costs, fill under 18 percent of their seats, carry the average urban resident less than four round trips per year, use more energy and spew out more greenhouse gases per passenger mile than the average Chevy Suburban, carry less than 2 percent of low-income workers to work, and lost more than 13 percent of their customers in the last four years. Continue reading

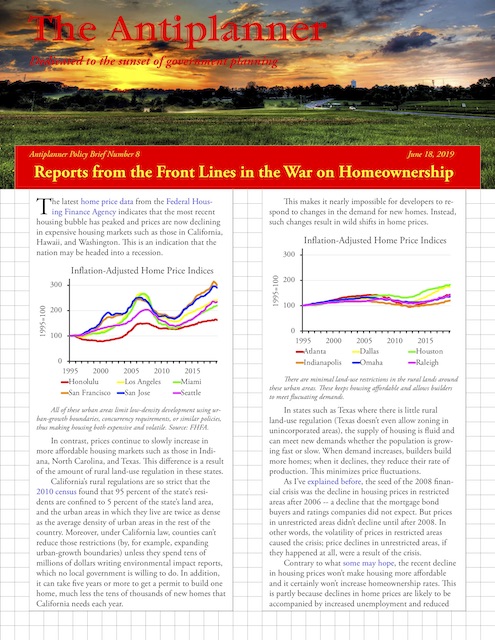
Reports from the War on Homeownership

The latest home price data from the Federal Housing Finance Agency indicates that the most recent housing bubble has peaked and prices are now declining in expensive housing markets such as those in California, Hawaii, and Washington. This is an indication that the nation may be headed into a recession.

Click image to download a four-page PDF of this policy brief.

In contrast, prices continue to slowly increase in more affordable housing markets such as those in Indiana, North Carolina, and Texas. This difference is a result of the amount of rural land-use regulation in these states. Continue reading