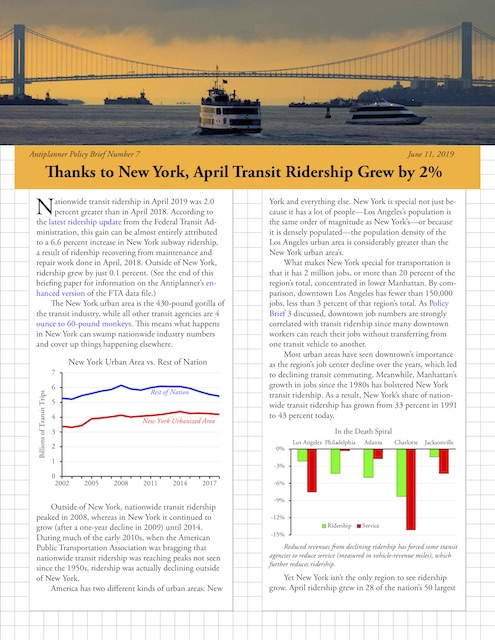
Nationwide transit ridership in April 2019 was 2.0 percent greater than in April 2018. According to the latest ridership update from the Federal Transit Administration, this gain can be almost entirely attributed to a 6.6 percent increase in New York subway ridership, a result of ridership recovering from maintenance and repair work done in April, 2018. (See the end of this post for information on the Antiplanner’s enhanced version of the FTA data file.)
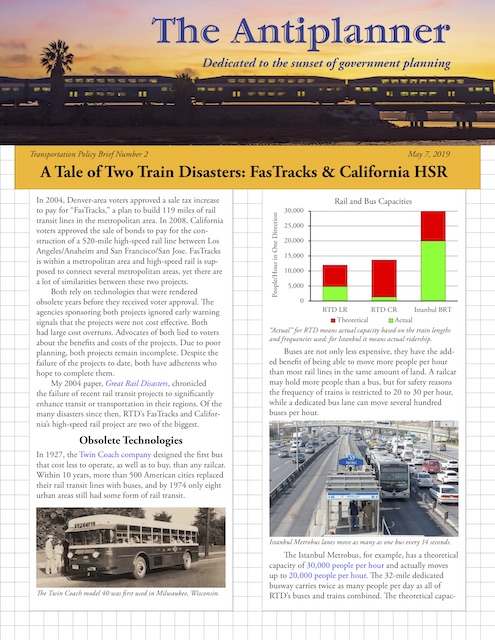
 Click image to download a three-page PDF of this policy brief.
The New York urban area is the 430-pound gorilla of the transit industry, while all other transit agencies are 4 ounce to 60-pound monkeys. This means what happens in New York can swamp nationwide industry numbers and cover up things happening elsewhere. Continue reading