Light rail is safe to ride, but it is one of the most dangerous forms of travel in the United States. That’s because most of the people who are killed by light-rail trains aren’t riding them; they are people struck by the trains. According to Federal Transit Administration (FTA) data, 657 fatalities have been associated with light rail since 2002, but only 20 of them were passengers on board the trains.
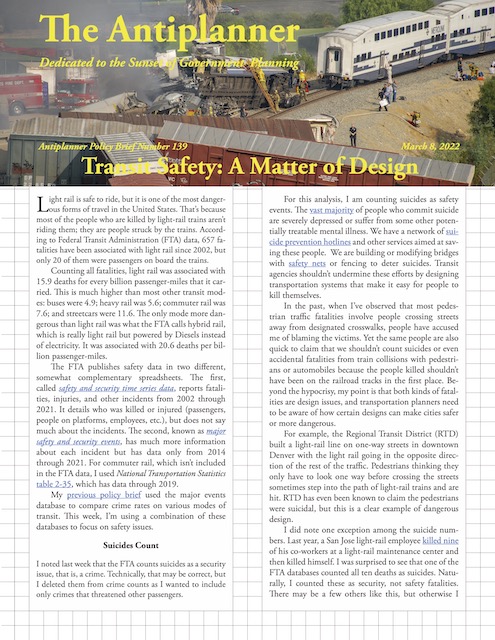 Click image to download a four-page PDF of this policy brief.
Counting all fatalities, light rail was associated with 15.9 deaths for every billion passenger-miles that it carried. This is much higher than most other transit modes: buses were 4.9; heavy rail was 5.6; commuter rail was 7.6; and streetcars were 11.6. The only mode more dangerous than light rail was what the FTA calls hybrid rail, which is really light rail but powered by Diesels instead of electricity. It was associated with 20.6 deaths per billion passenger-miles. Continue reading